


 46 / 204

Immature palms make
up 1,560 ha of the
Group’s total planted
area, which means
the Group’s crops
are projected to rise
strongly in the
coming years.
Group FFB
Harvested
(MT)
166,080
FYE2019
FYE2018
175,774
Meanwhile, PBT stood at RM23.80
million (before the writeback
of impairment losses which is
discussed hereinbelow), which
was 40.9% lower than the PBT
of RM40.28 million achieved last
year. Our estates in Malaysia which
are still in the process of land
development or palm planting
registered a higher total pretax loss
of RM4.5 million compared to RM2.5
million pretax loss recorded last
year following to the acquisition of
Ladang Bunga Tanjong Sdn. Bhd.
which was completed in February
2018.
The division had in Q2 FYE2019
reversed a previously recorded
impairment on property, plant
and equipment in the Group’s
Indonesian subsidiary, PT Nunukan
Jaya Lestari (“PTNJL”) as a
consequence of the Mahkamah
Agung’s decision that the Ministerial
Order revoking PTNJL’s HGU
be annulled. The reversal of the
impairment has a positive effect
of RM23.63 million whereupon the
division’s PBT for FYE2019 would be
RM47.43 million with the inclusion
of the writeback.
FFB produced by PTNJL decreased
6.1% to 164,770 MT (FYE2018:
175,425 MT). A lower average
yield per hectare of 25.98 MT was
recorded compared to 27.53 MT
last year. FFB purchased from third
parties also decreased to 49,902
MT from 60,460 MT in prior year.
Note that FFB production was back
to normal following to the bumper
crops recorded last year which is
due to post recovery of El-Nino.
CPO and CPKO production during
the year under review were 47,966
MT and 4,434 MT respectively
(FYE2018: 51,887 MT and 4,013
MT respectively) in line with the
decline in FFB production and
lower third-party crop. Average
CPKO price was RM3,015 per MT,
compared with RM4,431 per MT in
prior year. Meanwhile, the Group’s
oil extraction rate (“OER”) average
of 22.34% was slightly higher
compared to 22.09% OER recorded
last year.
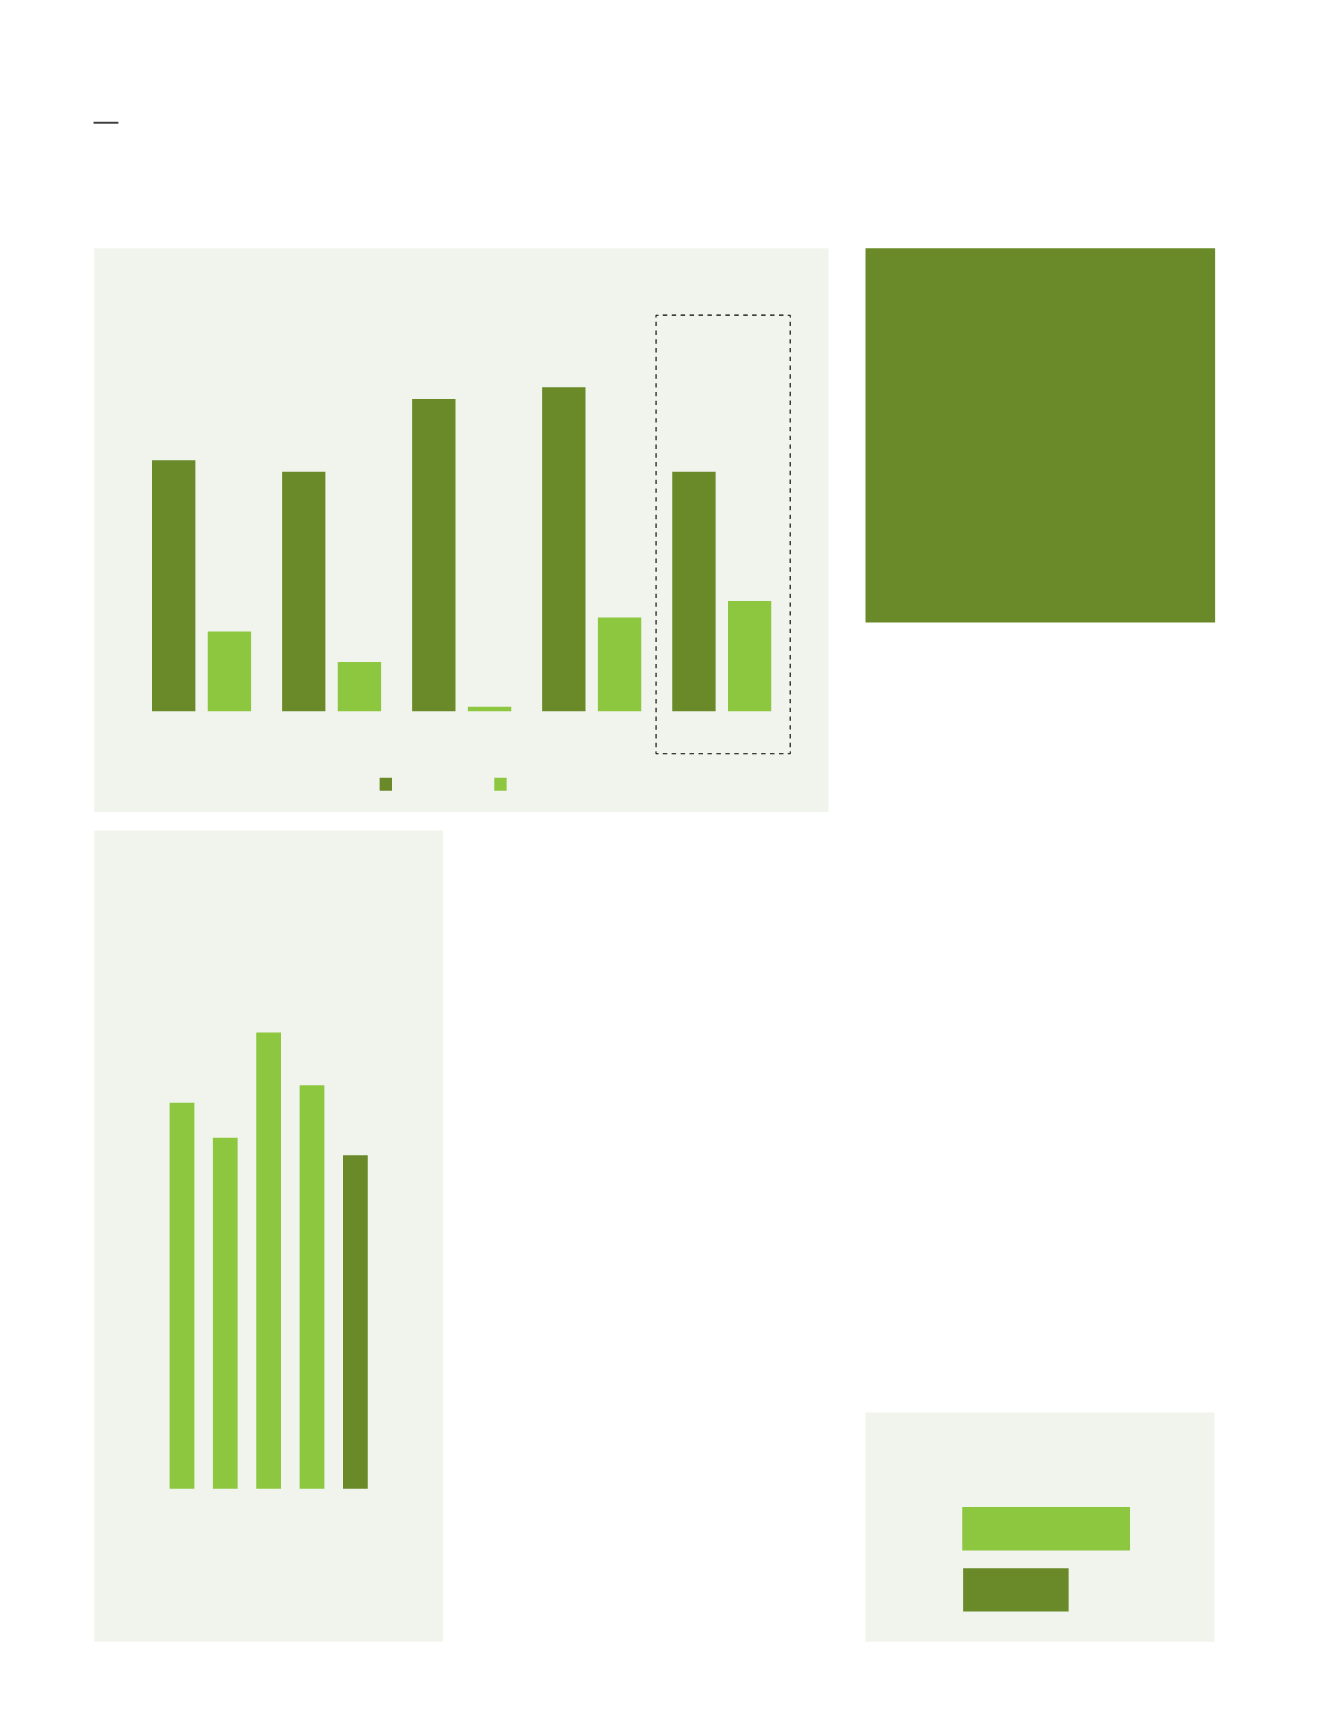
5-Year Revenue & PBT
Performance
(RM Million)
FYE2018
FYE2016
FYE2015
FYE2019
FYE2017
47.43
+17.8%
102.84
-25.5%
40.28
(0.55)
138.10
133.21
21.35
102.61
34.42
107.12
Revenue
PBT
Average CPO
Price Realised
(RM/MT)
FYE2015
2,207
2,064
2,625
2,342
1,921
FYE2016
FYE2017
FYE2018
FYE2019
Fima CORPORATION Berhad
(21185-P)
Annual Report 2019
42