


 12 / 16

Fima Corporation Berhad
(21185-P)
SUSTAINABILITY & governance
42
Head Office
Manufacturing
Plantation
Total
Senior Management
1
2
1
4
Management
3
14
3
20
Executive
5
29
28
62
Non-Executive
16
281
1,318
1,615
Total
25
326
1,350
1,701
Nationality
Malaysia
Indonesia
Total
Malaysian
386
5
391
Indonesian
20
1,269
1,289
Others
21
-
21
Total
427
1,274
1,701
Ratio of local : foreign
5 : 1
127 : 1
Age Group
Male
Female
<30
76%
24%
30-35
69%
31%
>55
57%
43%
Employee Breakdown
as at 31 march 2017
Breakdown of employees by Nationality
employee age group by division
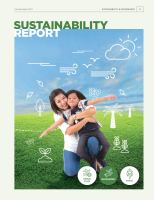
Diversity and Gender Balance
In FYE2016/17, the Group’s workforce
stood at 1,701 strong and is made up of
29% women and 71% men. It is worth
noting, however, that due to the nature of
certain job functions, such as manual work
in our plantation operations, the female
take-up rate for these jobs tends to be
significally lower.
Male
Female
29%
71%
GROUP
25%
40%
75%
60%
MALAYSIA
INDONESIA
sustainability report