


 29 / 188

25
F i m a C o r p o r at i o n B e r h a d ( 2 1 1 8 5 - P ) •
A n n u a l R e p o r t 2 0 1 8
MANAGEMENT DISCUSSION AND ANALYSIS
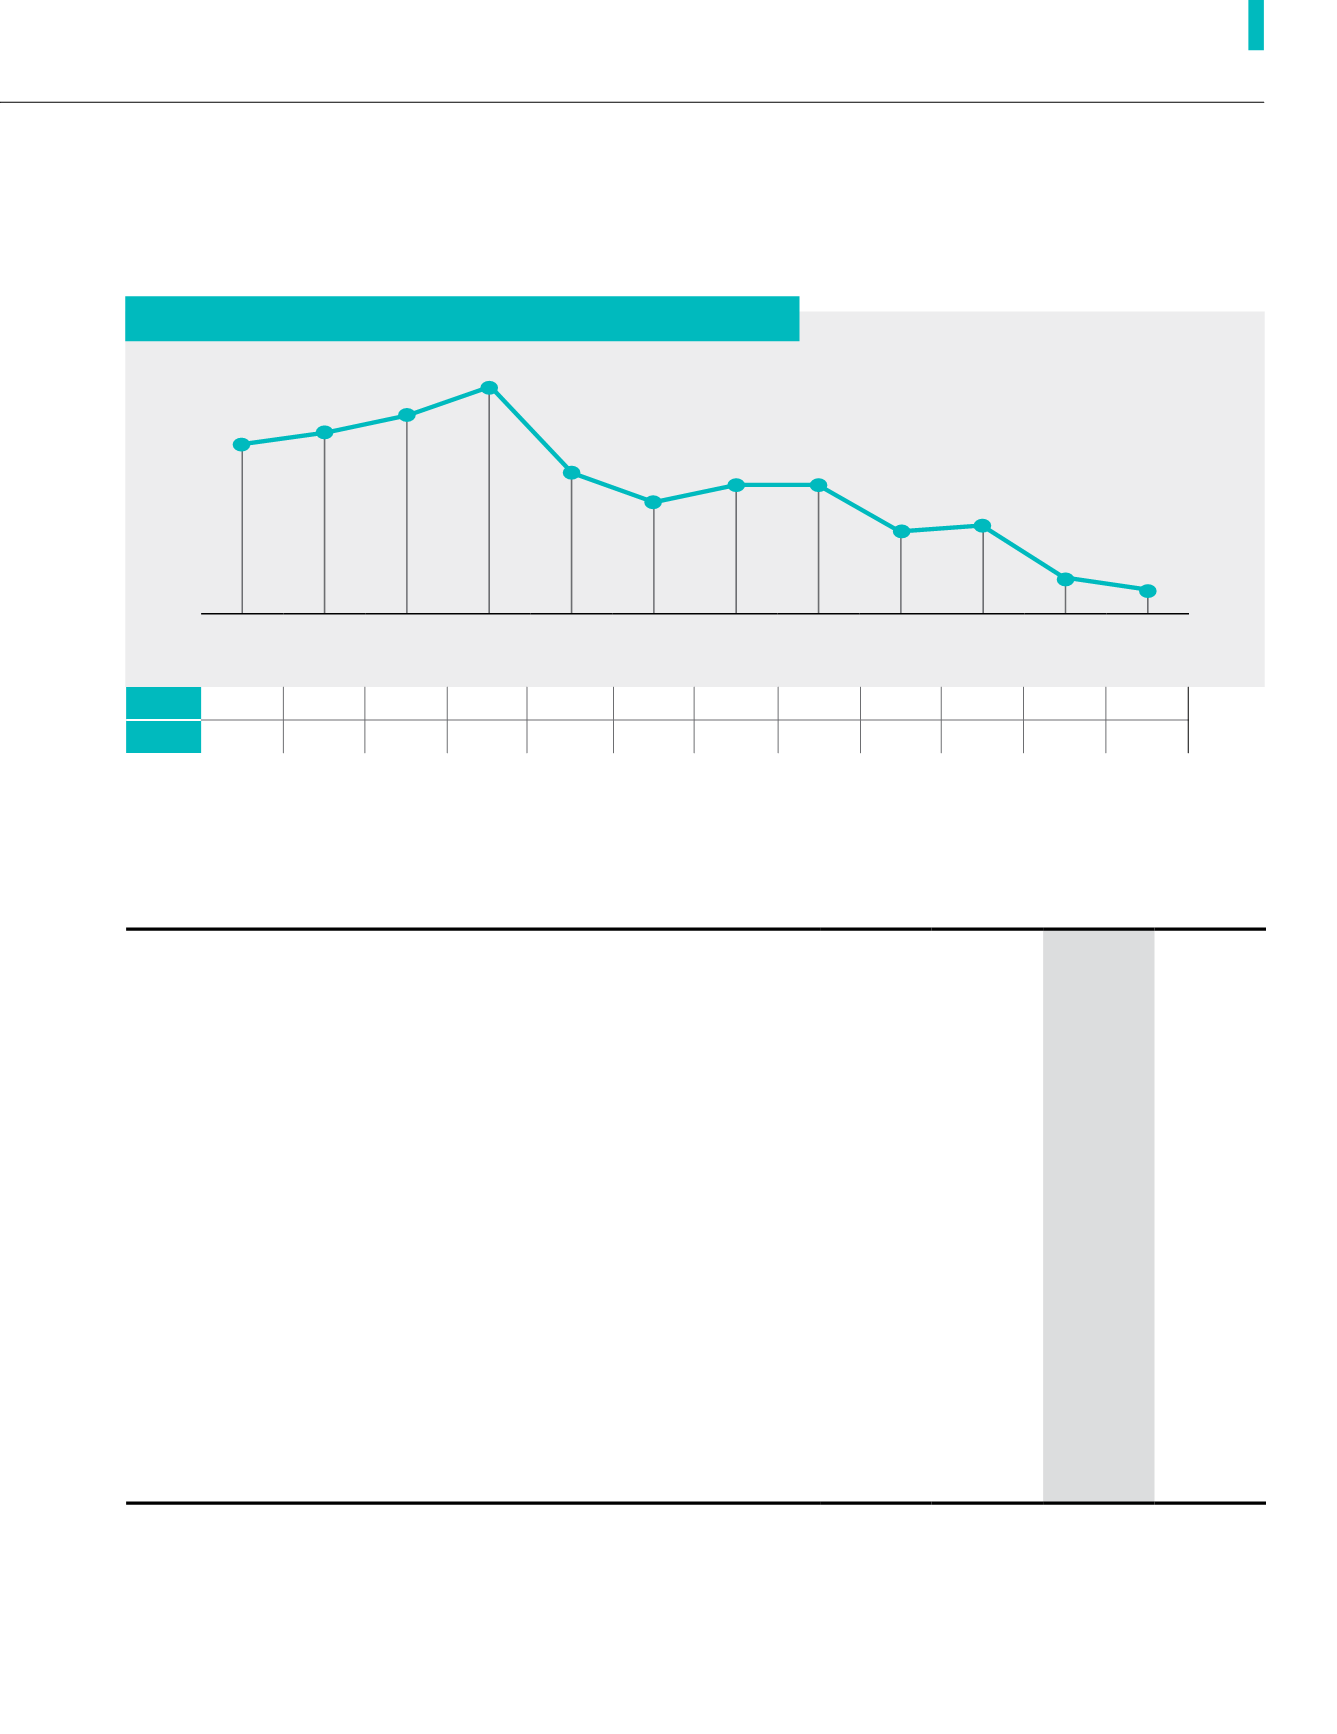
One Year Average Monthly Closing Price (RM)
KEY FINANCIAL ANALYSIS
Apr,
2017
May,
2017
Jun,
2017
Jul,
2017
Aug,
2017
Sep,
2017
Oct,
2017
Nov,
2017
Dec,
2017
Jan,
2018
Feb,
2018
Mar,
2018
2.23
2.25
2.28
2.33
2.18
2.13
2.16 2.16
2.08 2.09
2.00
1.98
During the year under review, the highest and lowest share price transacted were RM2.36 and RM1.95, respectively. The highest
share volume transacted was in May 2017 with total volume of 1.52 million shares.
High
2.25 2.27 2.32 2.36 2.35 2.21 2.18 2.22 2.16 2.14 2.10 2.02
Low
2.20 2.14 2.20 2.22 2.17 2.12 2.12 2.13 2.06 2.01 1.98 1.95
Key Financial Indicators
FYE2017 FYE2018 % Change
Revenue
RM’ Million
372.10 284.65
(23.5)
Cost of Sales (COS)
RM’ Million
229.65 169.23
(26.3)
Gross Profit
RM’ Million
142.45 115.42
(19.0)
Gross Profit Margin
%
38.3
40.6
5.7
Earnings Before Interest and Taxation (“EBIT”)
RM’ Million
61.34
63.41
3.4
Profit Before Tax (“PBT”)
RM’ Million
61.26*
63.30
3.3
Profit After Tax (“PAT”)
RM’ Million
35.01
42.21
20.6
Return on Average Shareholders’ Equity (“ROAE”)
%
6.0
7.3
21.6
Return on Average Capital Employed (“ROACE”)
%
10.1
10.6
5.0
Total Returns to Shareholders
- Dividend Per Share
sen
17.5
12.5**
(28.6)
Retained Earnings
RM’ Million
449.56 443.80
(1.3)
Total Assets
RM’ Million
715.34 639.90
(10.6)
Total Liabilities
RM’ Million
128.54
74.62
(42.0)
Capital Employed
RM’ Million
608.09 587.58
(3.4)
* Without the impairment losses of RM29.37 million related property, plant and equipment and biological assets, the Group’s PBT would be RM90.63 million.
** Subject to shareholders’ approval on the single-tier final dividend of 7.5 sen.