


 30 / 188

P E R F O RM A N C E
26
MANAGEMENT DISCUSSION AND ANALYSIS
Group revenue decreased by 23.5% to
RM284.65million fromRM372.10million in
FYE2017 mainly due to the sharp decline
in Manufacturing Division’s revenue
impacted by the expiration of a major
supply contract, thereby offsetting the
revenue improvements of the Plantation
Division which increased by 3.7% y-o-y.
Growth in the Group’s FFB production
from 131,484 MT harvested last year to
175,774 MT resulting from better yield per
mature hectare of 25.2 MT (FYE2017: 20.5
MT) was the key driver behind Plantation
Division’s improved results.
During the year, the Group’s
PBT
improved by 3.3% to RM63.30 million
from RM61.26 million recorded in the
previous year on the back of improved
PBT contributions from the Plantation
Division which stood at RM41.07 million
compared to a loss of RM0.55 million
last year. Manufacturing Division posted
PBT of RM25.48 million, representing a
57.3% decline y-o-y, due to the sharp
decline in revenue resulting from the
expiration of a major supply contract.
Financial Resources
and Liquidity
The Group’s
Retained Earnings
FYE2018 stood at RM443.80 million
against RM449.56 million in the previous
year. The variance was due to the
dividend payment of RM42.20 million
compared to the profit attributable to
the equity holders of the Company of
RM36.11 million.
Gross Profit
for the Group also declined
by 19.0% to RM115.42 million from
RM142.45 million on the back of lower
revenue registered during the financial
year. The decrease in revenue is mainly
attributable to decline in revenue
contribution from Manufacturing by
39.7%.
The Group recorded higher
Gross
Profit Margin
by 2.3% from last year
(FYE2017: 38.3%) due to improved
result in Plantation Division. The division
Segmental Profit Before Tax (“PBT”) Analysis
GROUP PBT
RM63.30
Million
3.3% increase Y-o-Y
(FYE2017: RM61.26 Million)
FYE2017 Contribution FYE2018 Contribution
RM’million
% RM’million
%
Manufacturing
59.61
97.3
25.48
40.3
Plantation
(0.55)
(0.9)
41.07
64.9
Share of Results
of Associate
2.69
4.4
1.70
2.7
Property
Management
0.77
1.3
0.49
0.7
Others
(1.26)
(2.1)
(5.44)
(8.6)
Group Results
61.26
100
63.30
100
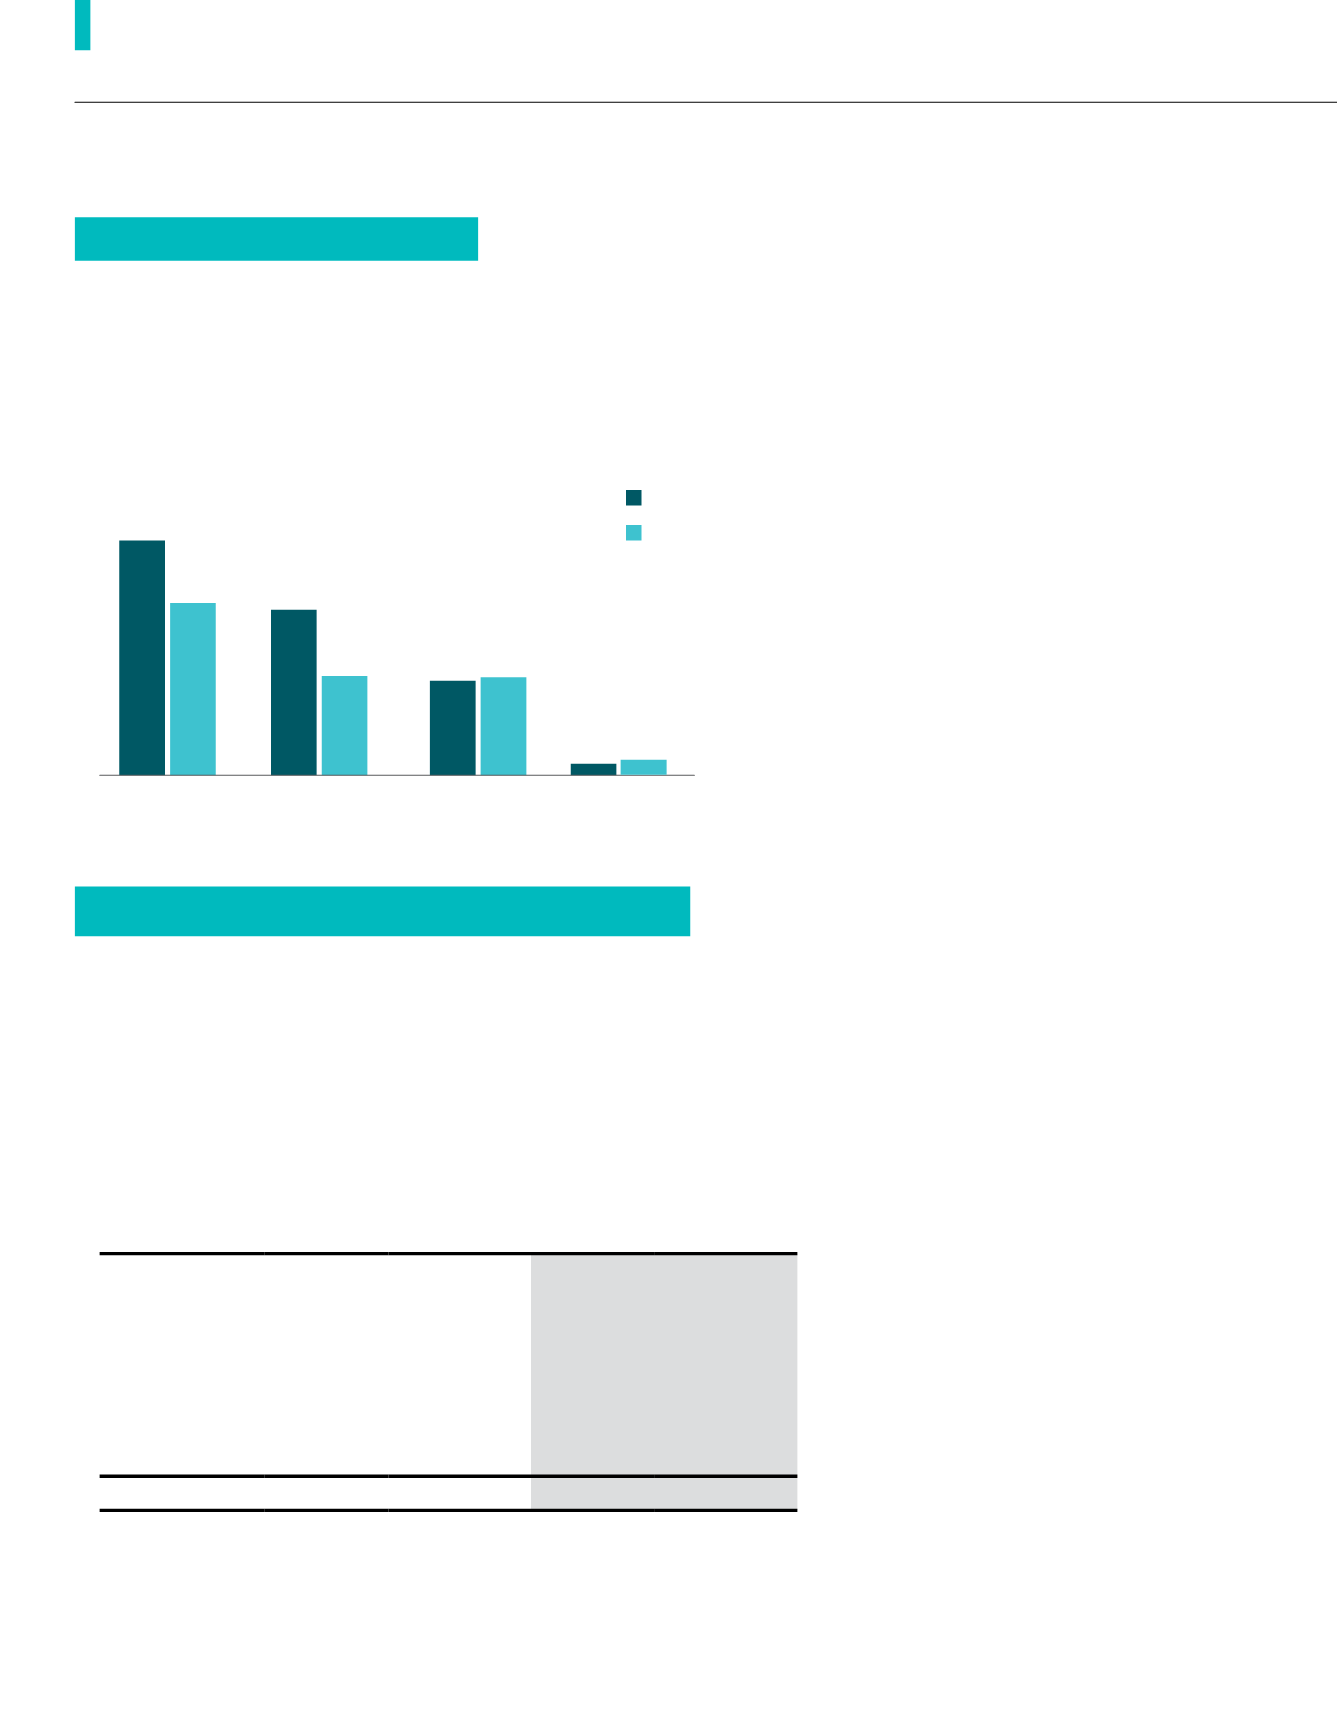
Segmental Revenue Analysis
GROUP REVENUE
RM284.65
Million
23.5% Decrease Y-o-Y
(FYE2017: RM372.10 Million)
Manufacturing
Group
Plantation
Property
Management
▼
23.5%
▼
39.7%
▲
3.7%
▲
4.2%
5.77
5.54
140.78
233.35
284.65
372.10
138.10
133.21
FYE2017
FYE2018