


 38 / 188

P E R F O RM A N C E
34
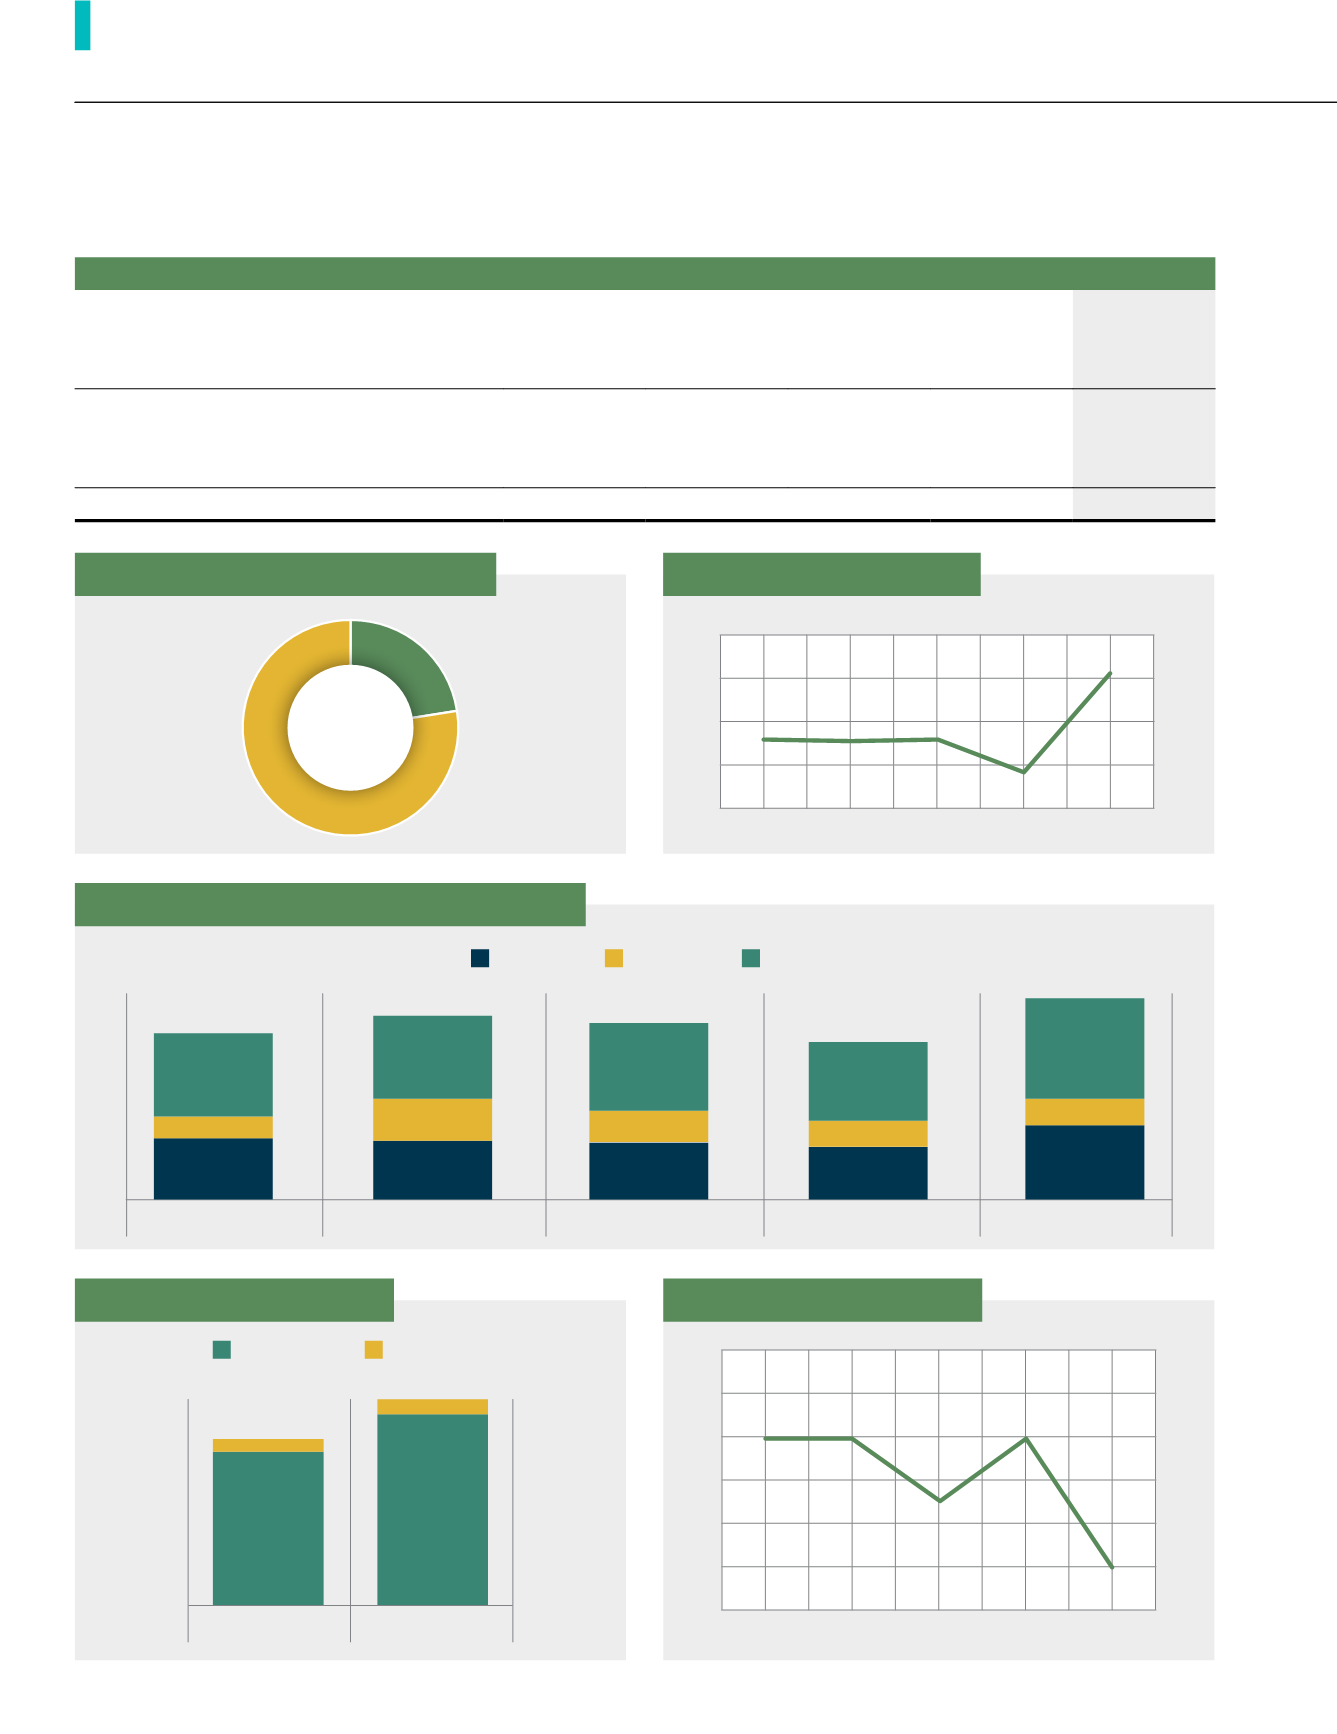
Palm Profiles (HA)
FYE2014
FYE2015
FYE2016
FYE2017
FYE2018
Mature
4 - 9 years
476
440
403
336
365
10 - 18 years
5,979
6,030
6,030
6,043
6,058
6,455
6,470
6,433
6,379
6,423
Rehab
-
-
-
-
566
Immature
52
-
489
1,101
1,241
Total Planted Area
6,507
6,470
6,922
7,480
8,230
plantation statistics
5-Year FFB Breakdown Analysis (MT)
150,703
49,144
199,847
149,701
60,677
210,378
149,060
53,198
202,258
131,484
51,853
183,337
175,774
60,460
236,234
FYE2014
FYE2015
FYE2016
FYE2017
FYE2018
Own Estate
Purchased
Total FFB
FYE2014 FYE2015 FYE2016 FYE2017 FYE2018
Yield Per Hectare (MT)
23.4 23.1 23.2
20.5
25.2
Planted Area Breakdown (HA)
◄
peninsular
malaysia
1,858
►
indonesia
6,372
Mill Performance (MT)
41,619
51,887
3,419
4,013
FYE2017
FYE2018
CPO Volumes
CPKO Volumes
Oil Extraction Rate (%)
FYE2014 FYE2015 FYE2016 FYE2017 FYE2018
22.7 22.7
22.4
22.7
22.1