


 57 / 204

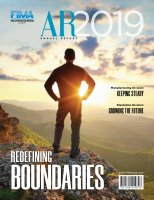
BOD
17%
83%
Senior
Management
100%
Management
8%
92%
Executive
28%
72%
Non-
Executive
25%
75%
Male
Female
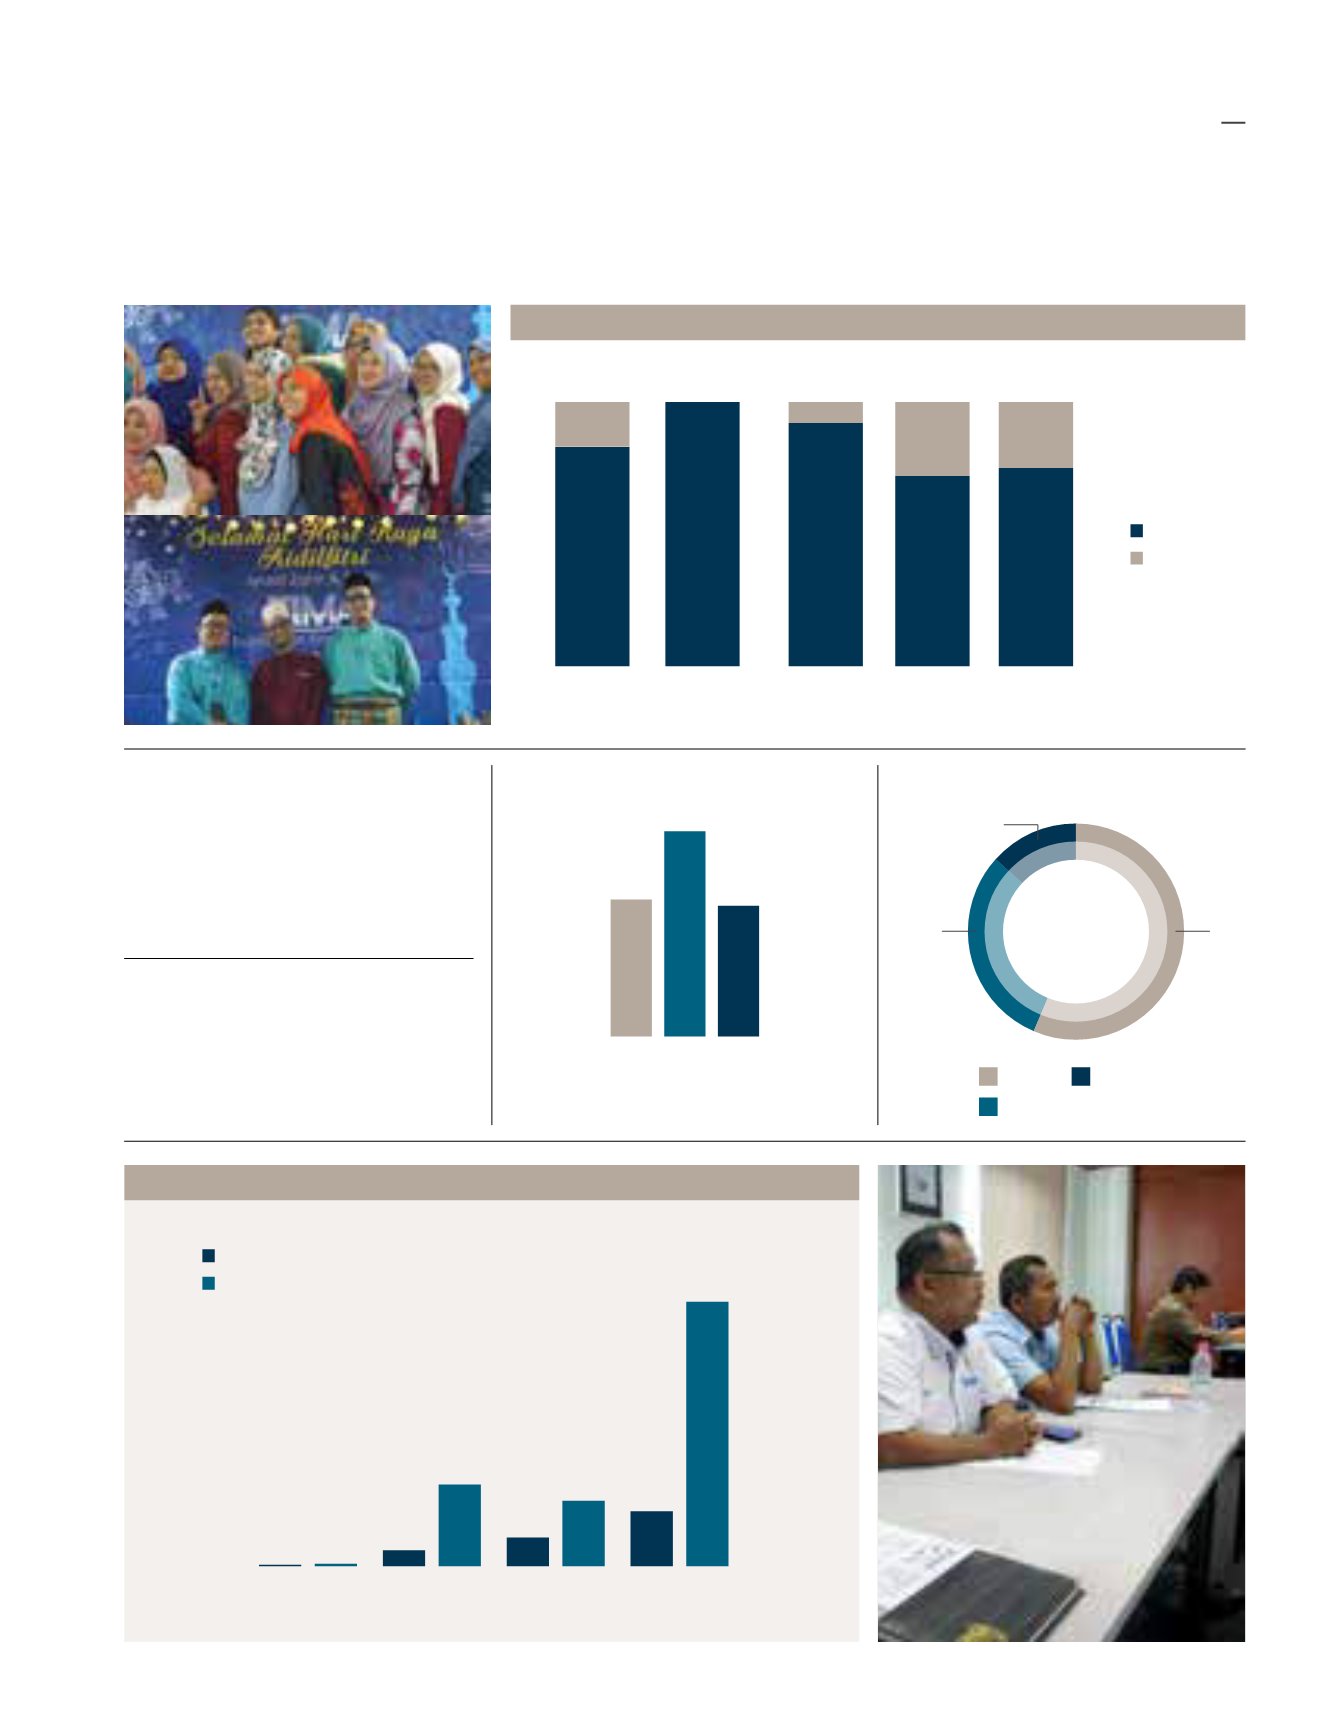
Lost Time Incident
Frequency Rate (LTIFR)
The Group recorded an LTIFR of
20.96
site for every 1 million
man-hours worked
(FYE2018: 6.92)
Total
Training Hours
The Group recorded
6,111
of training hours
(FYE2018: 1,493 hours)
Total No. of Recorded Injuries
1 Day 2-4
Days
>4
Days
22
33
21
Days of Medical Leave
Taken As Result of Injury
Tools
Physical
Falling objects
Total Injuries By Type
43
23
10
FYE2018
FYE2019
Senior
Management
Management
Executive
Non-
Executive
24
64
423
962
238
1,201
808
3,884
Total Workforce Breakdown by Gender & Position FYE2019
Training Hours Breakdown by Position
sustainability performance
metrics
SUSTAINABILITY
STATEMENT
53