


 30 / 204

Fima CORPORATION Berhad
(197401004110) (21185-P) •
Annual Report 2020
28
Apr-19 May-19 Jun-19 Jul-19 Aug-19 Sep-19 Oct-19 Nov-19 Dec-19 Jan-20 Feb-20 Mar-20
High
1.95
1.95
1.96
1.96
1.94
1.88
1.78
1.79
1.83
1.80
1.76
1.50
Low
1.89
1.84
1.87
1.90
1.86
1.76
1.72
1.71
1.70
1.72
1.50
1.01
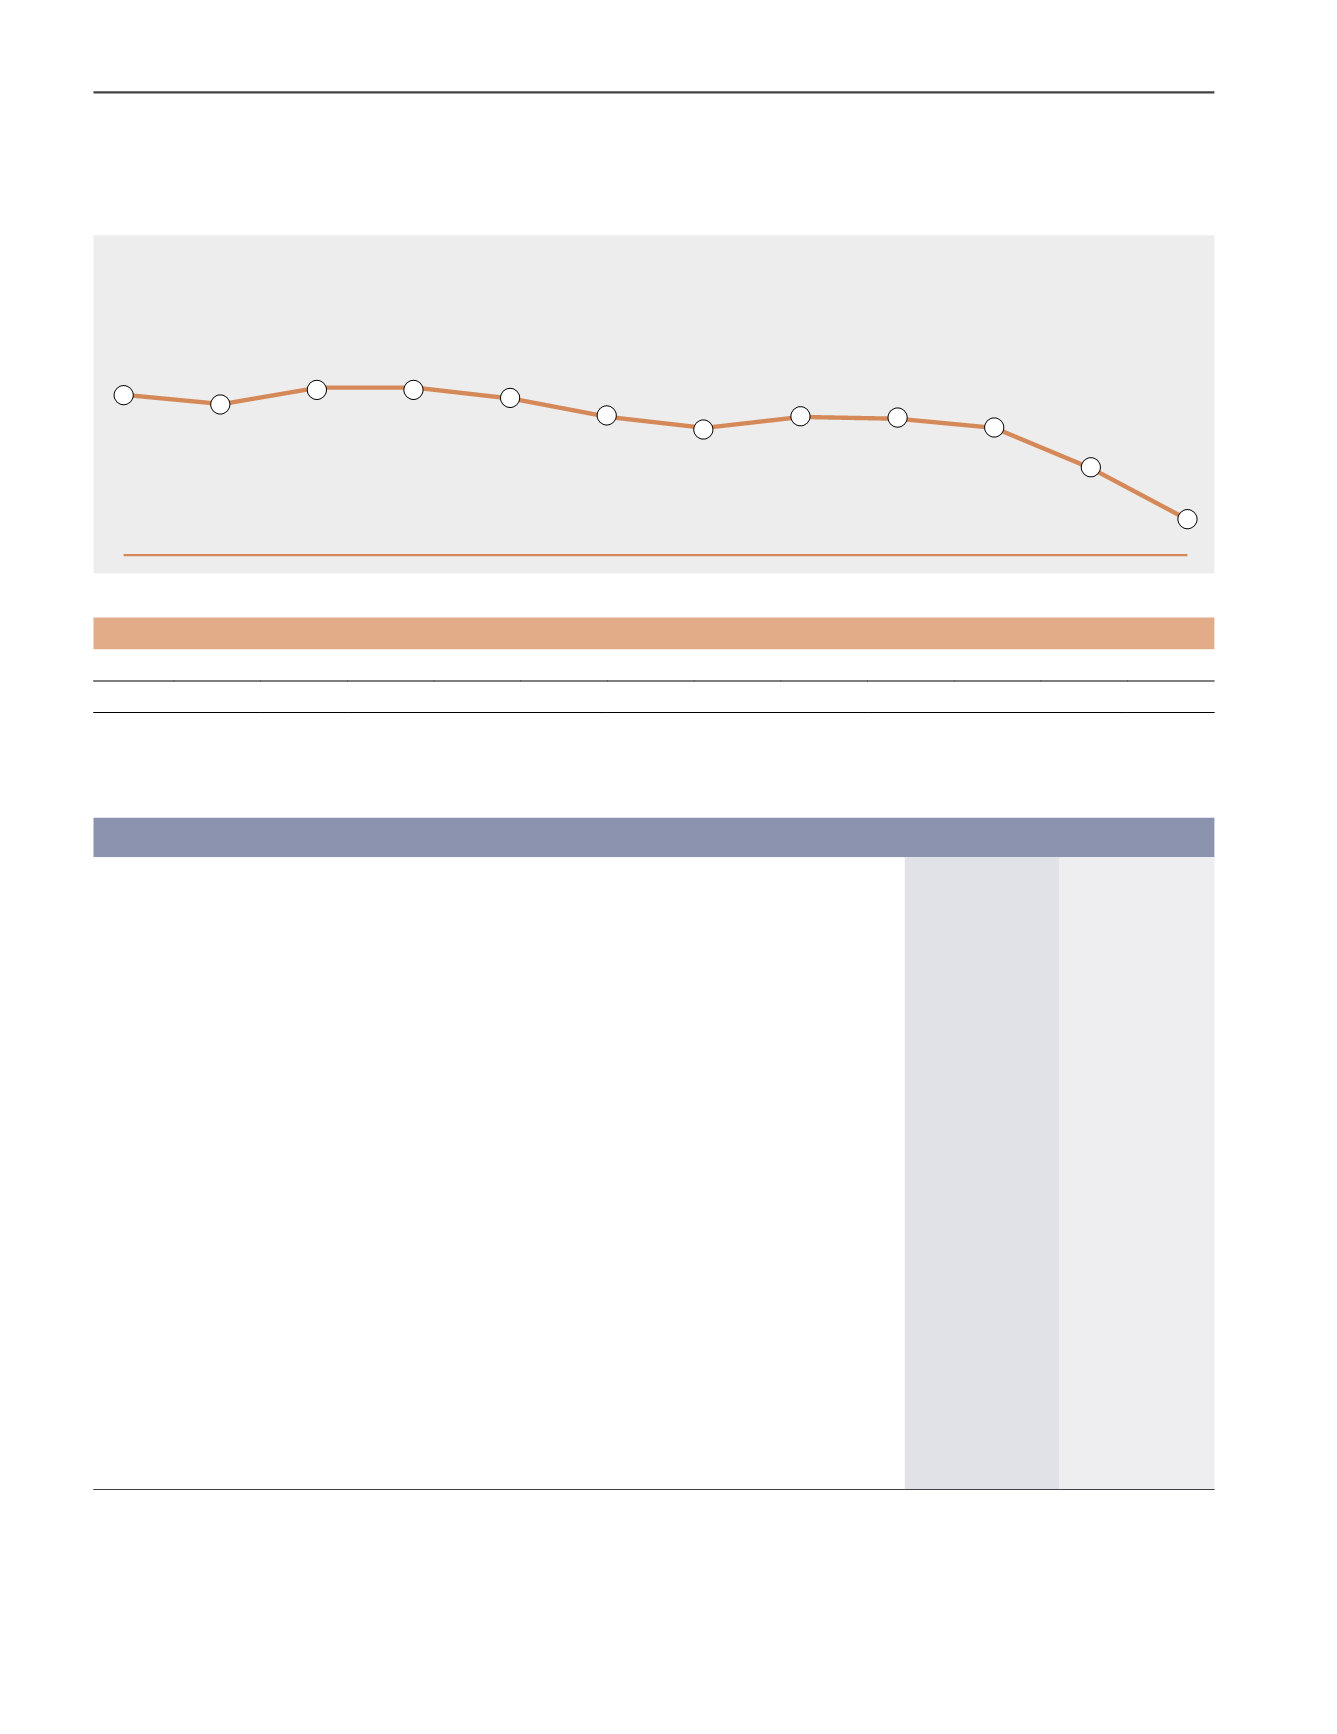
During the year under review, the highest and lowest share price transacted were RM1.96 and RM1.01 respectively. The highest monthly
share volume transacted was in March 2020 with total volume of 1.34 million shares.
FYE 2019
FYE 2020
Change %
Revenue
RM Million
244.72
243.13
(0.7)
Cost of Sales (COS)
RM Million
145.24
162.34
11.8
Gross Profit
RM Million
99.48
80.79
(18.8)
Gross Profit Margin
%
40.7
33.2
(7.4)
Earnings Before Interest and Taxation (“EBIT”)
RM Million
79.65
18.50
(76.8)
Profit Before Tax (“PBT”)
RM Million
79.48
18.13
(77.2)
Profit Before Tax and Impairment
RM Million
*55.85
*35.92
(35.7)
Profit After Tax (“PAT”)
RM Million
65.33
8.81
(86.5)
Return on Equity (“ROE”)
%
10.9
1.6
(9.4)
Return on Capital Employed (“ROCE”)
%
12.8
3.2
(9.7)
Total Returns to Shareholders
- Dividend (sen per share)
sen
12.5
**12.5
-
Retained Earnings
RM Million
460.34
441.99
(4.0)
Total Assets
RM Million
673.73
630.68
(6.4)
Total Liabilities
RM Million
76.57
64.69
(15.5)
Capital Employed
RM Million
620.66
586.87
(5.4)
* Before impairment/reversal of impairment pursuant to Mahkamah Agung’s decision
** Include second interim dividend of 7.5 sen which is payable on 7 September 2020
Key Financial Analysis
Apr-19
oct-19
jul-19
jan-20
may-19
nov-19
aug-19
feb-20
sep-19
mar-20
jun-19
dec-19
Share Price FYE2020
ONE YEAR AVERAGE MONTHLY CLOSING PRICE (RM)
1.22
1.50
1.72
1.77
1.78
1.72
1.78
1.88
1.94
1.94
1.85
1.90