


 33 / 204

Fima CORPORATION Berhad
(197401004110) (21185-P) •
Annual Report 2020
31
Capital Employed is one of the primary measures of how
efficiently the company utilise all available capital to generate
additional profits, As a result of the lower earnings recorded
during the year under review,
ROCE
declined to 3.2% from 12.8%
recorded last year.
Liquidity & Financial Resources
During the year,
Total Liabilities
decreased to RM64.69 million
from RM76.57 million and total equity reduced to RM565.99 million
from RM597.16 million resulting in the decrease in gearing ratio to
0.11 times.
The Group’s
Cash and Bank Balances and Short-Term Cash
Investments
stood at RM174.58 million, representing a decrease
of 15.2% from last year’s RM205.98 million. Despite a reduction
in revenue, the Group continues to generate strong cash flows.
Net Cash Flow Generated from Operating Activities
recorded a
surplus of RM17.57 million (FYE2019: surplus of RM35.06 million)
resulting from operating profit of RM42.89 million offset by net
changes in receivables and inventories balances as well payment
of taxes. The net cash used for capital expenditure and payment
of dividends totalled RM17.00 million and RM29.97 million
respectively.
Shareholders’ Equity
as at 31 March 2020 stood at RM565.99
million, a decrease of RM31.17 million or 5.2% from the previous
financial year mainly due to dividends paid during the period.
The
Share of Results of Associate
, Giesecke & Devrient (Malaysia)
Sdn Bhd decreased to RM1.96 million from RM3.73 million last year
on the back of lower revenue from Giesecke & Devrient Malaysia
Sdn Bhd (“G&D”). G&D posted a reduction in revenue of RM166.83
million (FYE2019: RM184.08 million) and PBT of RM10.69 million
(FYE2019: RM17.67 million).
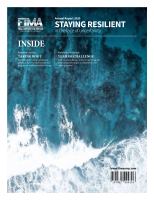
Capital Expenditure (“CAPEX”)
During the year, the Group’s CAPEX totalled RM17.00 million
compared to RM22.91 million in the previous year. The CAPEX
was incurred to meet ongoing CAPEX commitments during the
year. 95.9% of the Group’s total CAPEX spend which was largely
utilised towards plantation development works, new planting,
construction of workers quarters and purchase/replacement of
fixed assets. Sources of funds for CAPEX during the year were
generated internally.
Group CAPEX
(RM Million)
FYE2019
22.91
FYE2020
17.00
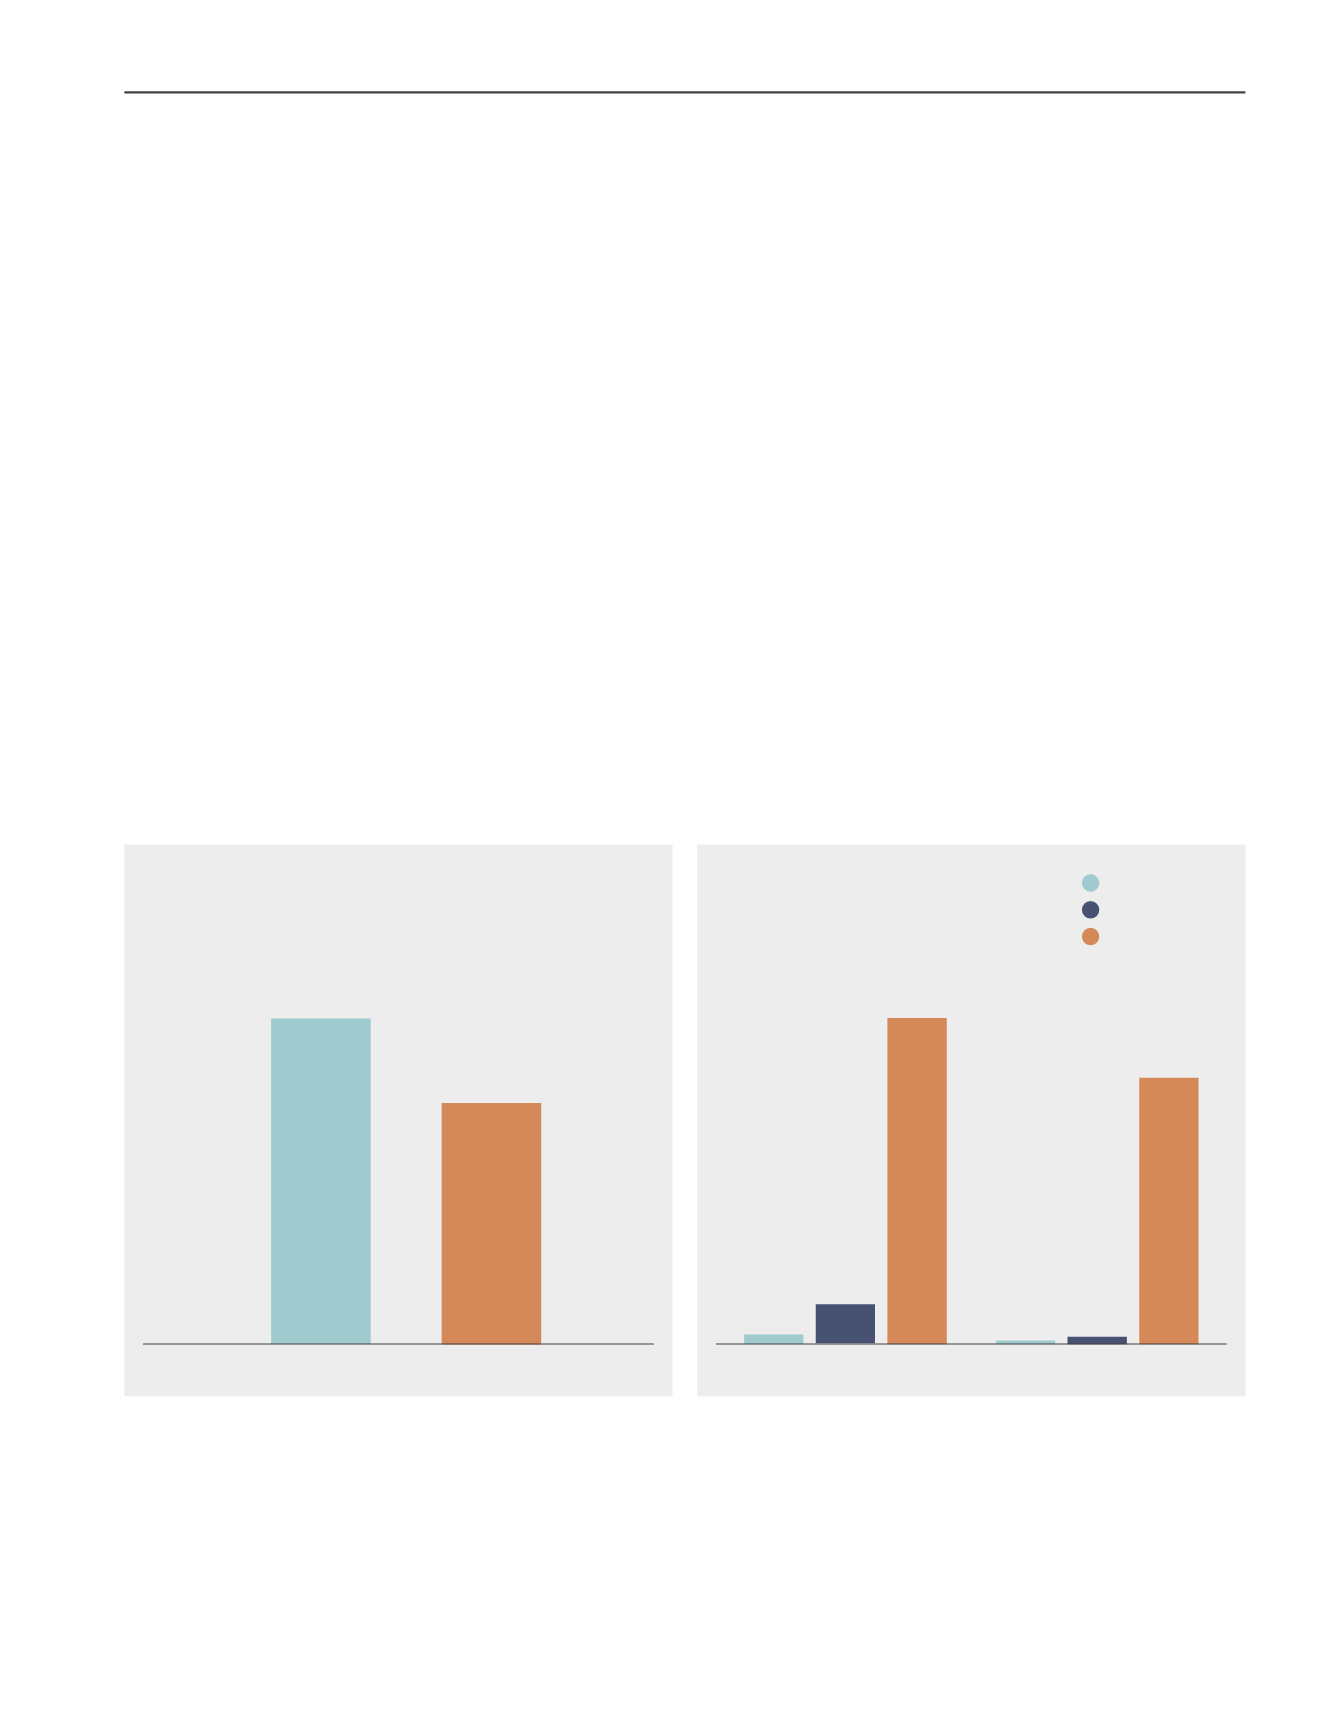
CAPEX By Division
(RM Million)
Others
Manufacturing
Plantation
FYE2020
16.30
0.46
0.24
FYE2019
0.58
19.95
2.38