


 45 / 72

Head Office
Our greenhouse gas emissions
FYE2018
FYE2019
Scope 1 – Direct emission
15.94 tCO
2
eq/litre*
15.24 tCO
2
eq/litre
Scope 2 – Indirect emission
1,386.25 tCO
2
eq/kWh
1,318.08 tCO
2
eq/kWh
Total emissions
1,402.19 tCO
2
eq*
1,333.32 tCO
2
eq
Emission intensity by square feet
0.0112 tCO
2
eq per square feet*
0.0109 tCO
2
eq per square feet
* restated
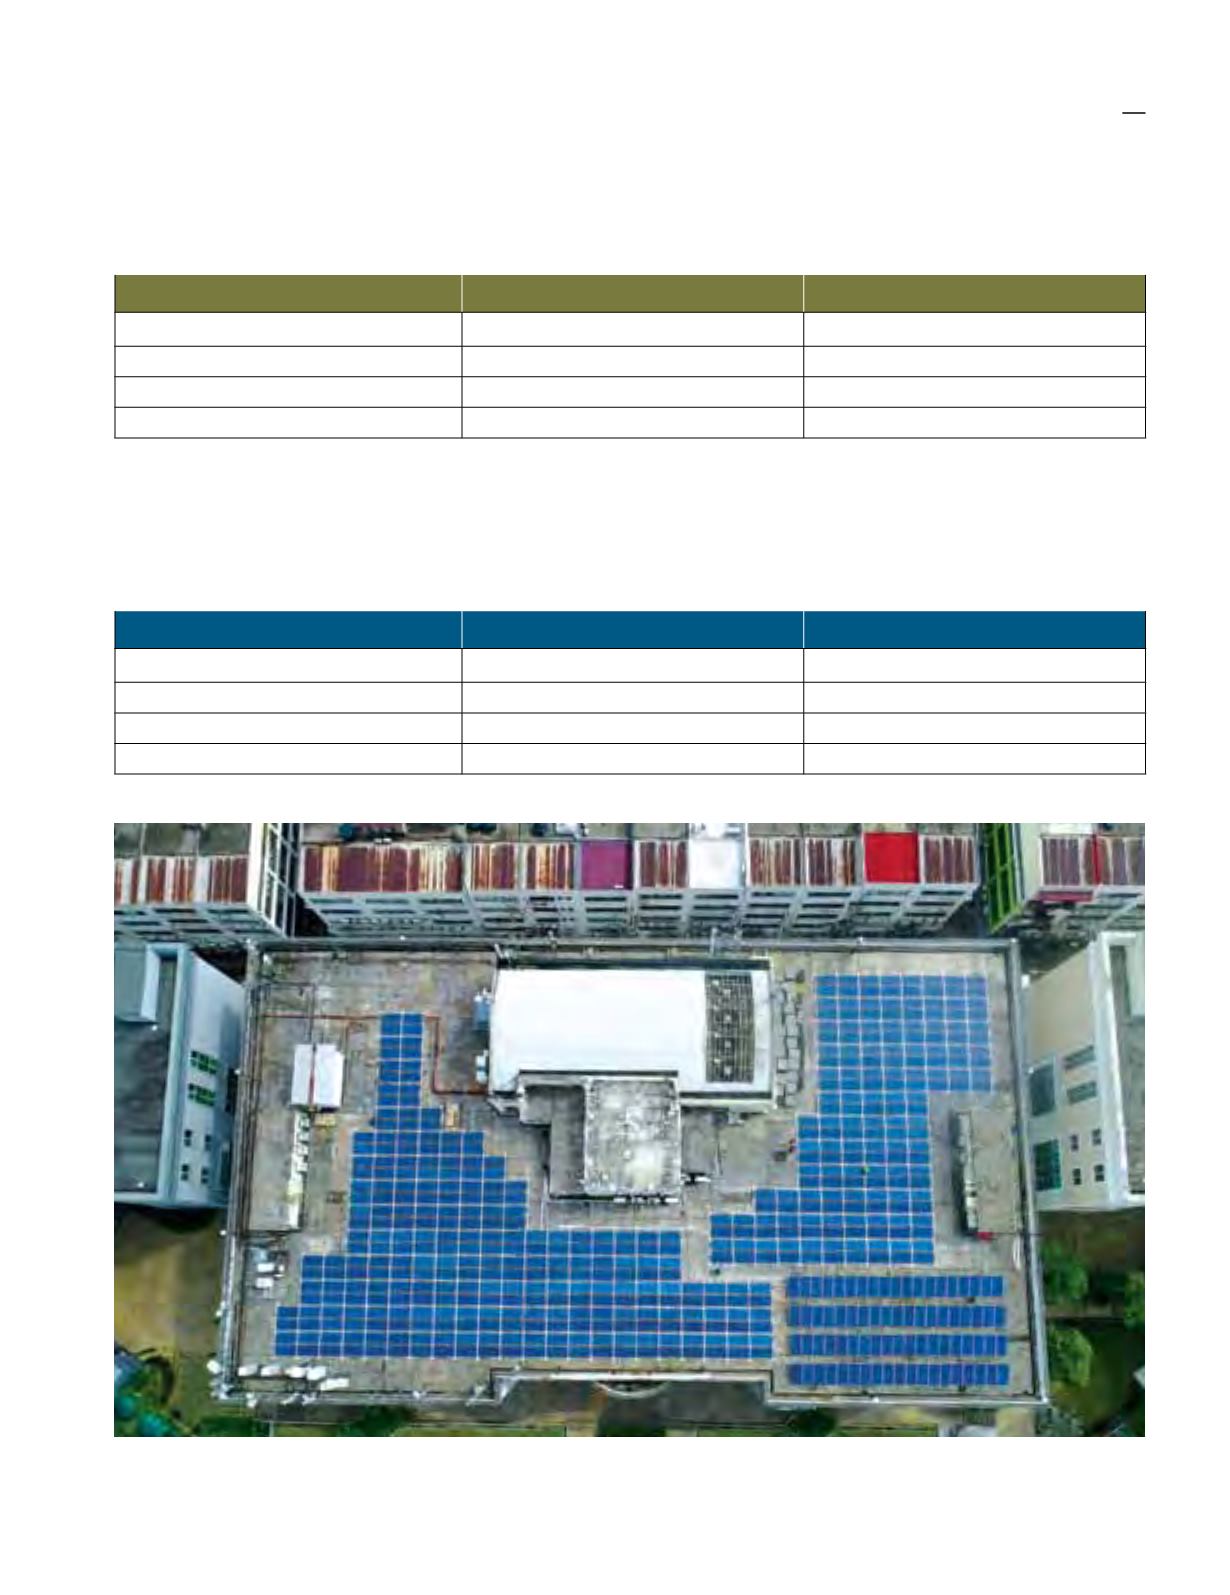
Our Head Office’s total emissions had dropped slightly this year compared to last year due to the CO
2
offset from
the installation of our building’s solar power panels; which meant we relied slightly less on the grid.
Manufacturing
Our greenhouse gas emissions
FYE2018
FYE2019
Scope 1 – Direct emission
89.28 tCO
2
eq/litre
19.95 tCO
2
eq/litre
Scope 2 – Indirect emission
2,641.83 tCO
2
eq/kWh
2,403.43 tCO
2
eq/kWh
Total emissions
2,731.11 tCO
2
eq
2,423.38 tCO
2
eq
Emission intensity by Operating Hour 0.6184 tCO
2
eq per operating hour* 0.7225 tCO
2
eq per operating hour
* restated
ENVIRONMENT
43