


 35 / 204

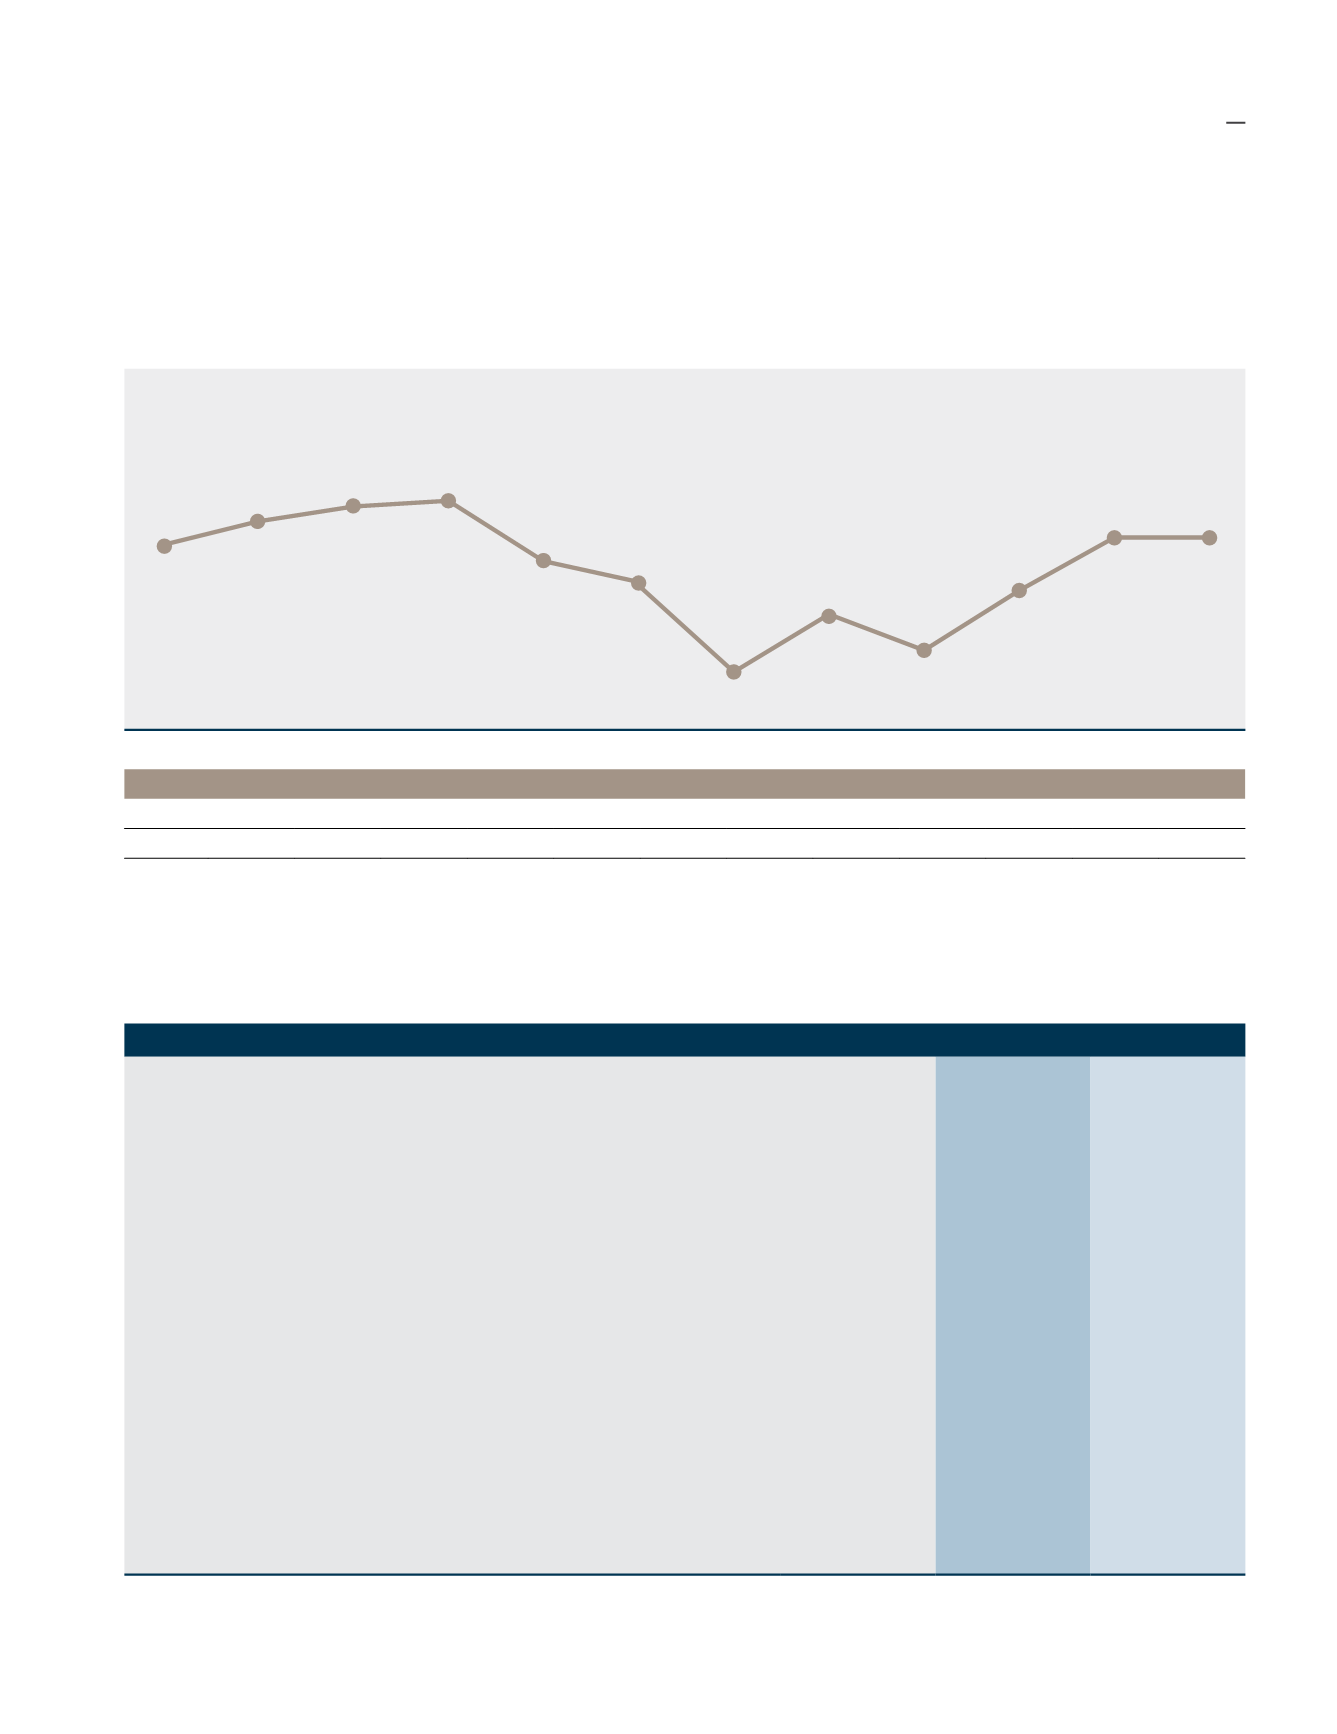
One Year Average Monthly Closing Share Price
(RM)
Apr’18
oct’18
jul’18
jan’19
may’18
nov’18
aug’18
feb’19
sep’18
mar’19
jun’18
dec’18
1.920
1.950 1.970 1.980
1.900
1.870
1.750
1.820
1.780
1.850
1.930 1.930
Month Apr-18 May-18 Jun-18 Jul-18 Aug-18 Sep-18 Oct-18 Nov-18 Dec-18 Jan-19 Feb-19 Mar-19
High
2.00 2.00 2.01
2.00 2.00 1.90
1.87
1.86
1.90
1.86
1.96
1.97
Low
1.92
1.91
1.93
1.91
1.90
1.83
1.75
1.75
1.76
1.78
1.82
1.92
Key Financial Indicators
FYE2018
FYE2019 % Change
Revenue
RM Million
284.65
244.72
(14.0)
Cost of Sales (COS)
RM Million
170.02
145.24
(14.6)
Gross Profit
RM Million
114.63
99.48
(13.2)
Gross Profit Margin
%
40.3
40.7
0.4
Earnings Before Interest and Taxation (“EBIT”)
RM Million
61.08
79.65
30.4
Profit Before Tax (“PBT”)
RM Million
60.97
79.48*
30.4
Profit After Tax (“PAT”)
RM Million
40.07
65.33
63.0
Return on Equity (“ROE”)
%
7.1
10.9
3.8
Return on Capital Employed (“ROCE”)
%
10.4
12.8
2.4
Total Returns to Shareholders
- Dividend (sen per share)
sen
12.5
12.5**
(40.0)
Retained Earnings
RM Million
432.87
460.34
6.3
Total Assets
RM Million
640.50
673.73
5.2
Total Liabilities
RM Million
75.15
76.57
1.9
Capital Employed
RM Million
588.18
620.66
5.5
* Without the write back of the impairment, the Group PBT would be RM55.85 million, 8.40% lower from previous year.
** Include final dividend of 7.5 sen which is subject to shareholders’ approval at the upcoming AGM.
Key Financial Analysis
Share Price FYE2019
During the year under review, the highest and lowest share price transacted were RM2.01 and RM1.75 respectively.
The highest monthly share volume transacted was in August 2018 with a total volume of 1.49 million shares.
performance
review
31