


 36 / 204

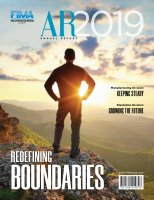
Segmental Revenue Analysis
Breakdown of revenue by division:
FYE2018
RM Million
Contribution
%
FYE2019
RM Million
Contribution
%
Variance
RM Million
Variance
%
Manufacturing
140.78
49.5
134.78
55.1
(6.00)
(4.3)
Plantation
138.10
48.5
102.84
42.0
(35.26)
(25.5)
Property Management
5.77
2.0
7.10
2.9
1.33
23.1
Group Results
284.65
100.0
244.72
100.0
(39.93)
(14.0)
The Group recorded revenue of RM244.72 million (FYE2018: RM284.65 million) during the financial year,
representing a decrease of 14.0% compared to the previous year, reflecting the lower contributions from our
Manufacturing and Plantation divisions. Meanwhile, Property Management’s revenue improved by RM1.33 million
year-on-year (“y-o-y”) due to positive contributions from the division’s engineering consultation services unit.
Manufacturing division revenue declined by 4.3% to RM134.78 million, impacted by the expiration of the contract to
supply certain travel document products.
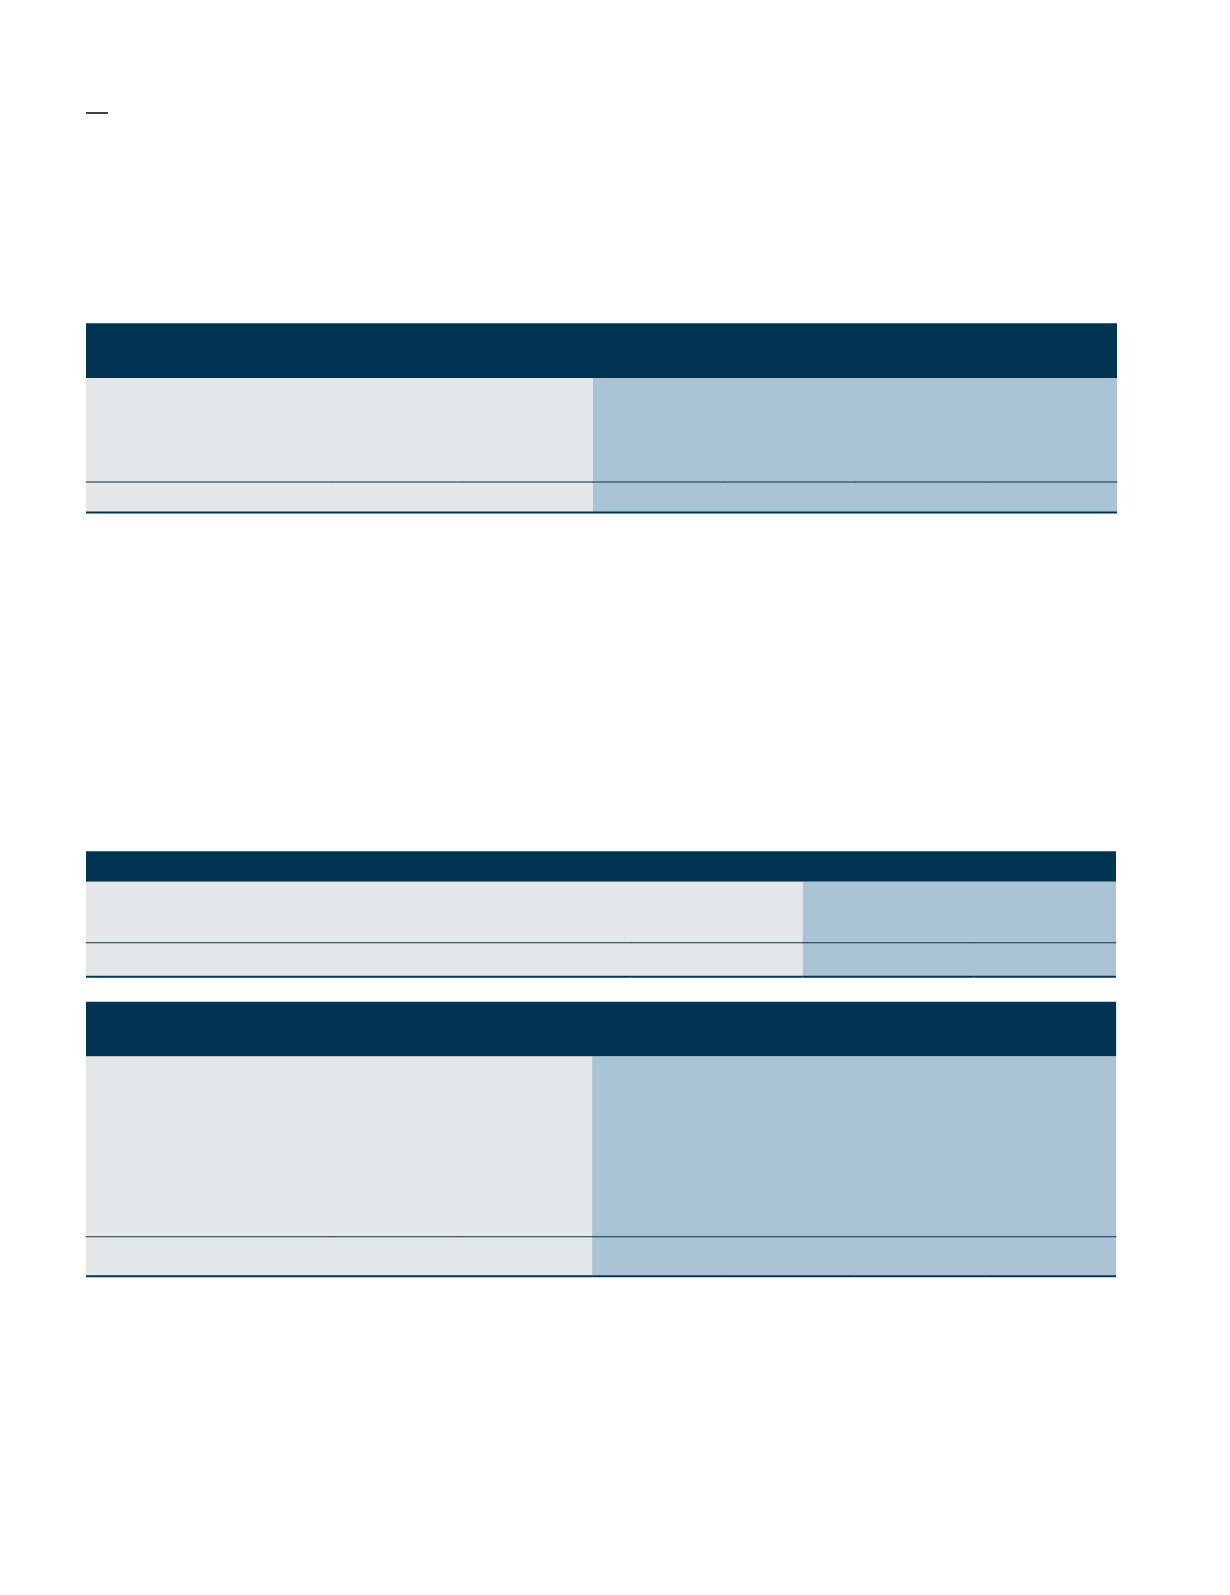
The drop in Plantation’s revenue was largely due to lower commodity prices coupled with a reduction in fresh fruit
bunches (“FFB”) produced during the financial year. Our average CIF Crude Palm Oil (“CPO”) (net of duty) selling
price in FYE2019 declined significantly by 18.0% to RM1,921 per MT (FYE2018: RM2,342 per MT). The average Crude
Palm Kernel Oil (“CPKO”) price achieved was also lower y-o-y at RM3,015 per MT (FYE2019: RM4,431 per MT).
FYE2018
FYE2019 Change %
CPO
RM2,342 per MT RM1,921 per MT
(18.0)
CPKO
RM4,431 per MT RM3,015 per MT
(32.0)
FFB Production
175,774 MT
166,080 MT
(5.84)
FYE2018
RM Million
Contribution
%
FYE2019
RM Million
Contribution
%
Variance
RM Million
Variance
%
Manufacturing
22.81
37.4
30.56
38.5
7.75
34.0
Plantation
40.28
66.1
47.43
59.7
7.15
17.8
Property Management
1.61
2.6
1.45
1.8
(0.16)
(9.9)
Share of Results of
Associate
1.70
2.8
3.73
4.7
2.04
120.0
Others
(5.43)
(8.9)
(3.70)
(4.7)
1.73
(31.9)
Group Results
60.97
100.0
79.48
100.0
18.51
30.4
The Group’s PBT in FYE2019 was RM79.48 million compared to RM60.97 million recorded in the prior year. The
increase in the PBT by 30.4% y-o-y was mainly attributed to the reversal of previous impairment on PPE in Q2
FYE2019 of RM23.63 million. Without the write back of the impairment, the Group PBT would be RM55.85 million,
8.40% lower from previous year.
Meanwhile, Manufacturing division’s recorded better PBT against last year was primarily due to higher write back
of inventories and reversal of certain provisions as well as lower direct costs and depreciation.
Fima CORPORATION Berhad
(21185-P)
Annual Report 2019
32