


 38 / 204

In tandem with improved in PAT,
Return on Equity (ROE)
for
FYE2019 stood at 10.9% (FYE2018:
7.1%) and is based on an average
shareholders’ equity of RM581.26
million (FYE2018: RM577.32
million).
Capital employed is how well the
company is using its capital to
generate profits. During the year
under review,
Return on Capital
Employed (ROCE)
improved by
2.4% to 12.8% from 10.4% posted in
the previous financial year.
Liquidity & Capital Resources
Typically, over the course of a year,
cash, short-term investments and
short-term debt may fluctuate
in order to manage the Group’s
liquidity. The Group believes it
has sufficient operating flexibility,
cash flow, cash and short-term
investment balances to meet
future operating needs of the
business as well as any scheduled
payments of debt. The net gearing
ratio of the Group as at 31 March
2019 remained low at 0.13 times.
The Group’s
Cash and Bank
Balances and Short-Term Cash
Investments
stood at RM205.98
million in total, representing a
1.7% decrease from a year ago of
RM209.48 million.
Typically, over the course of a year, cash,
short-term investments and short-term
debt may fluctuate in order to manage
the Group’s liquidity.
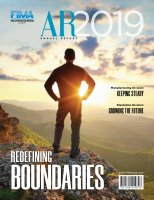
Group CAPEX
(RM Million)
FYE2018
FYE2019
9.91
22.91
+>100%
CAPEX By Division
(RM Million)
FYE2018
0.12
1.28
8.51
FYE2019
19.95
>+100%
2.38
>+85.99%
0.85
>+100%
Others
Manufacturing
Plantation
Despite a reduction in revenue,
the Group continue to generate
strong cash flow. The
Net Cash
Flow Generated from Operating
Activities
recorded a surplus of
RM35.06 million (FYE2018: deficit
of RM34.30 million) resulting
from operating profit of RM60.63
million offset by net changes
in receivables and inventories
balances as well as payment on
taxation.
Fima CORPORATION Berhad
(21185-P)
Annual Report 2019
34