


 43 / 204

Fima CORPORATION Berhad
(197401004110) (21185-P) •
Annual Report 2020
41
43,387
41,619
51,887
47,966
40,934
Plantation Statistics
Palm Age Profile (HA)
Year
FYE2016
FYE2017
FYE2018
FYE2019
FYE2020
> 19 years
-
-
-
-
-
10 – 18
6,030
6,043
6,058
6,560
6,702
4 – 9
403
336
365
390
546
6,433
6,379
6,423
6,950
7,248
Rehab
-
-
566
-
-
Immature
489
1,101
1,241
1,560
1,595
Total Planted Area
6,922
7,480
8,230
8,510
8,843
Total FFB (MT)
Year
FYE2016
FYE2017
FYE2018
FYE2019
FYE2020
FFB Production
149,060
131,484
175,774
166,080
156,450
FFB Purchased
53,198
51,853
60,460
49,902
40,257
202,258
183,337
236,234
215,982
196,707
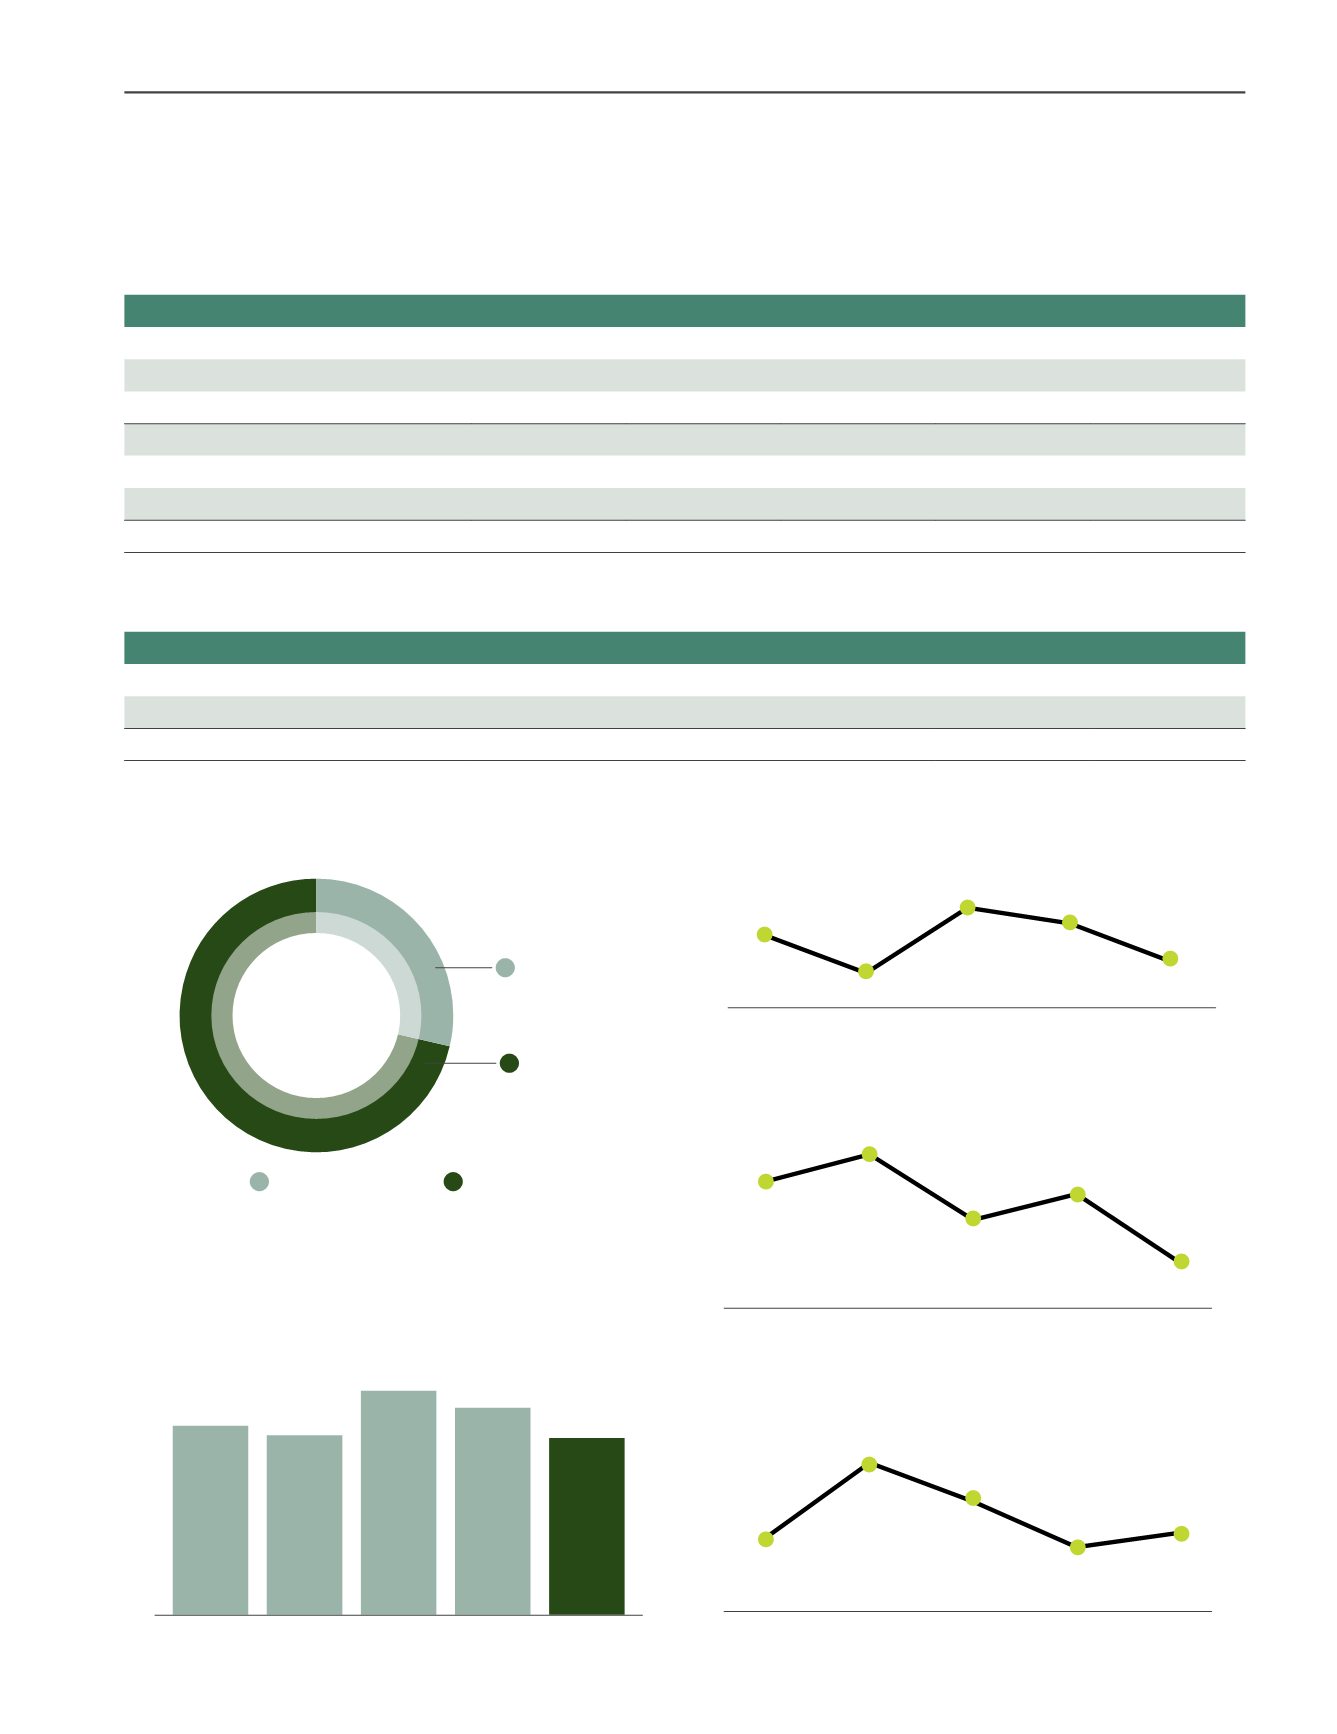
Oil Palm Planted Area (HA)
6,297,
71.2%
2,546,
28.8%
Indonesia
Peninsular Malaysia
CPO Production (MT)
FYE2016 FYE2017 FYE2018 FYE2019
FYE2020
Oil Extraction Rate (%)
FYE2016 FYE2017
FYE2018 FYE2019
FYE2020
21.68
22.34
22.09
22.70
22.42
Average CPO Price Realised (RM/MT)
FYE2016 FYE2017
FYE2018 FYE2019
FYE2020
2,073
1,921
2,342
2,625
2,064
Yield Per Hectare (MT)
FYE2016 FYE2017 FYE2018 FYE2019
FYE2020
24.19
25.15
20.54
23.17
21.58
plantation Division : taking root