


 8 / 72

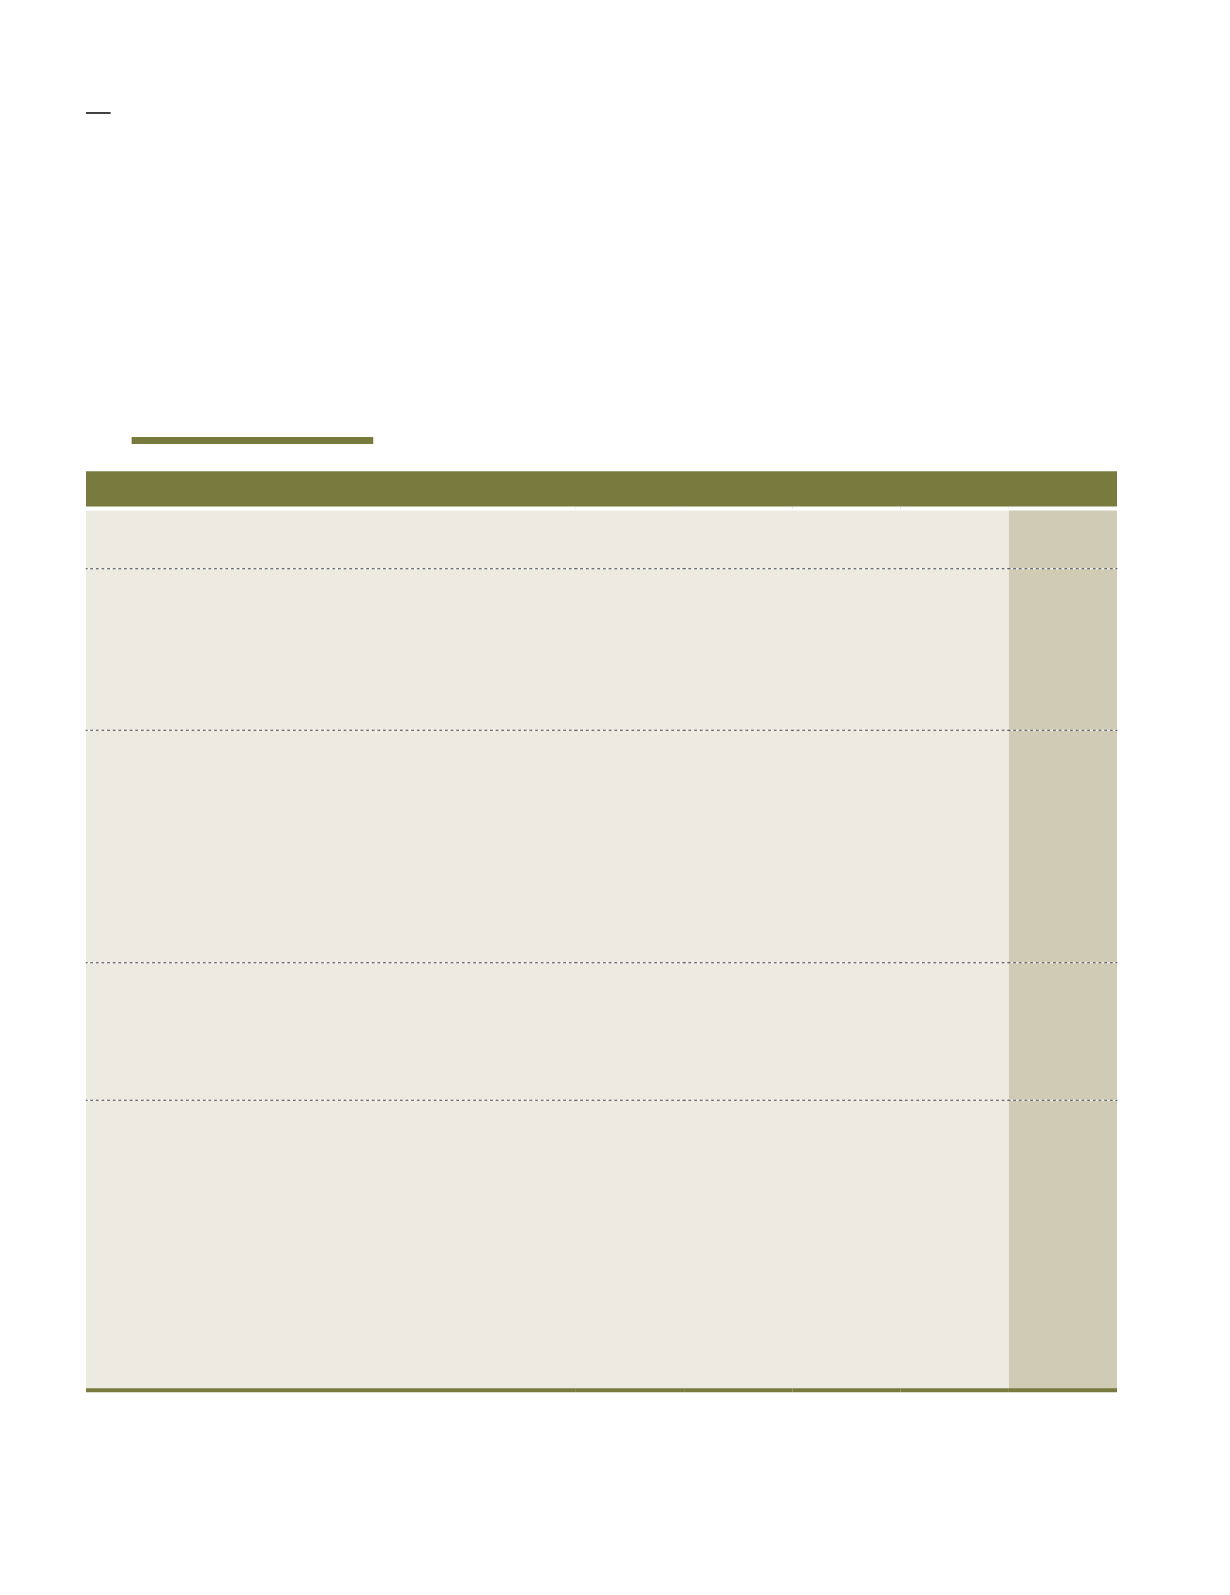
Financial Year Ended 31 March (RM’000)
FYE2015 FYE2016 FYE2017 FYE2018 FYE2019
REVENUE
378,014
375,207
372,101
284,646
244,720
PROFIT
Profit before tax
87,827
77,300
61,261
60,965 79,477
Profit after tax
60,305
54,872
35,007
40,074 65,326
(Loss)/profit attributable to
Non-controlling interests
4,544
3,590
(2,708)
5,952
7,880
ASSETS AND LIABILITIES
Total assets
712,804
684,559
718,659 640,502 673,727
Total liabilities
152,285
102,171
129,368
75,151
76,569
Financed by:
Shareholders' funds
530,529
554,247
563,378 546,393
573,775
Non-controlling interests
29,990
28,141
25,913 18,958 23,383
Net asset per share (RM)*
2.20
2.30
2.34
2.27
2.39
EARNINGS AND DIVIDEND*
Earnings per share (sen)
36.15
21.24
15.64
14.15
23.90
Dividends per share - Gross
12.5
12.5
17.5
12.5
12.5
Dividends per share - Net
12.5
12.5
17.5
12.5
12.5
SHARE PRICES
Transacted price per share (RM)
(i) Before share split
Highest
9.72
N/A
N/A
N/A
N/A
Lowest
7.80
N/A
N/A
N/A
N/A
(ii) After share split*
Highest
2.99
2.84
2.33
2.36
2.01
Lowest
2.14
2.09
2.02
1.95
1.75
* Note:
On 13 October 2014, 82,426,810 ordinary shares of RM1.00 each were split into 164,853,620 ordinary shares of
RM0.50 each. A bonus issue of 80,470,710 new subdivided shares was credited as fully paid-up on the basis of
one (1) bonus shares for every 2 subdivided shares, exclude treasury shares.
Financial
Highlights
06
Fima Corporation Berhad
(21185-P)
SUSTAINABILITY Report 2019