


 26 / 174

Fima Corporation Berhad
(21185-P)
performance
24
KEY FINANCIAL ANALYSIS
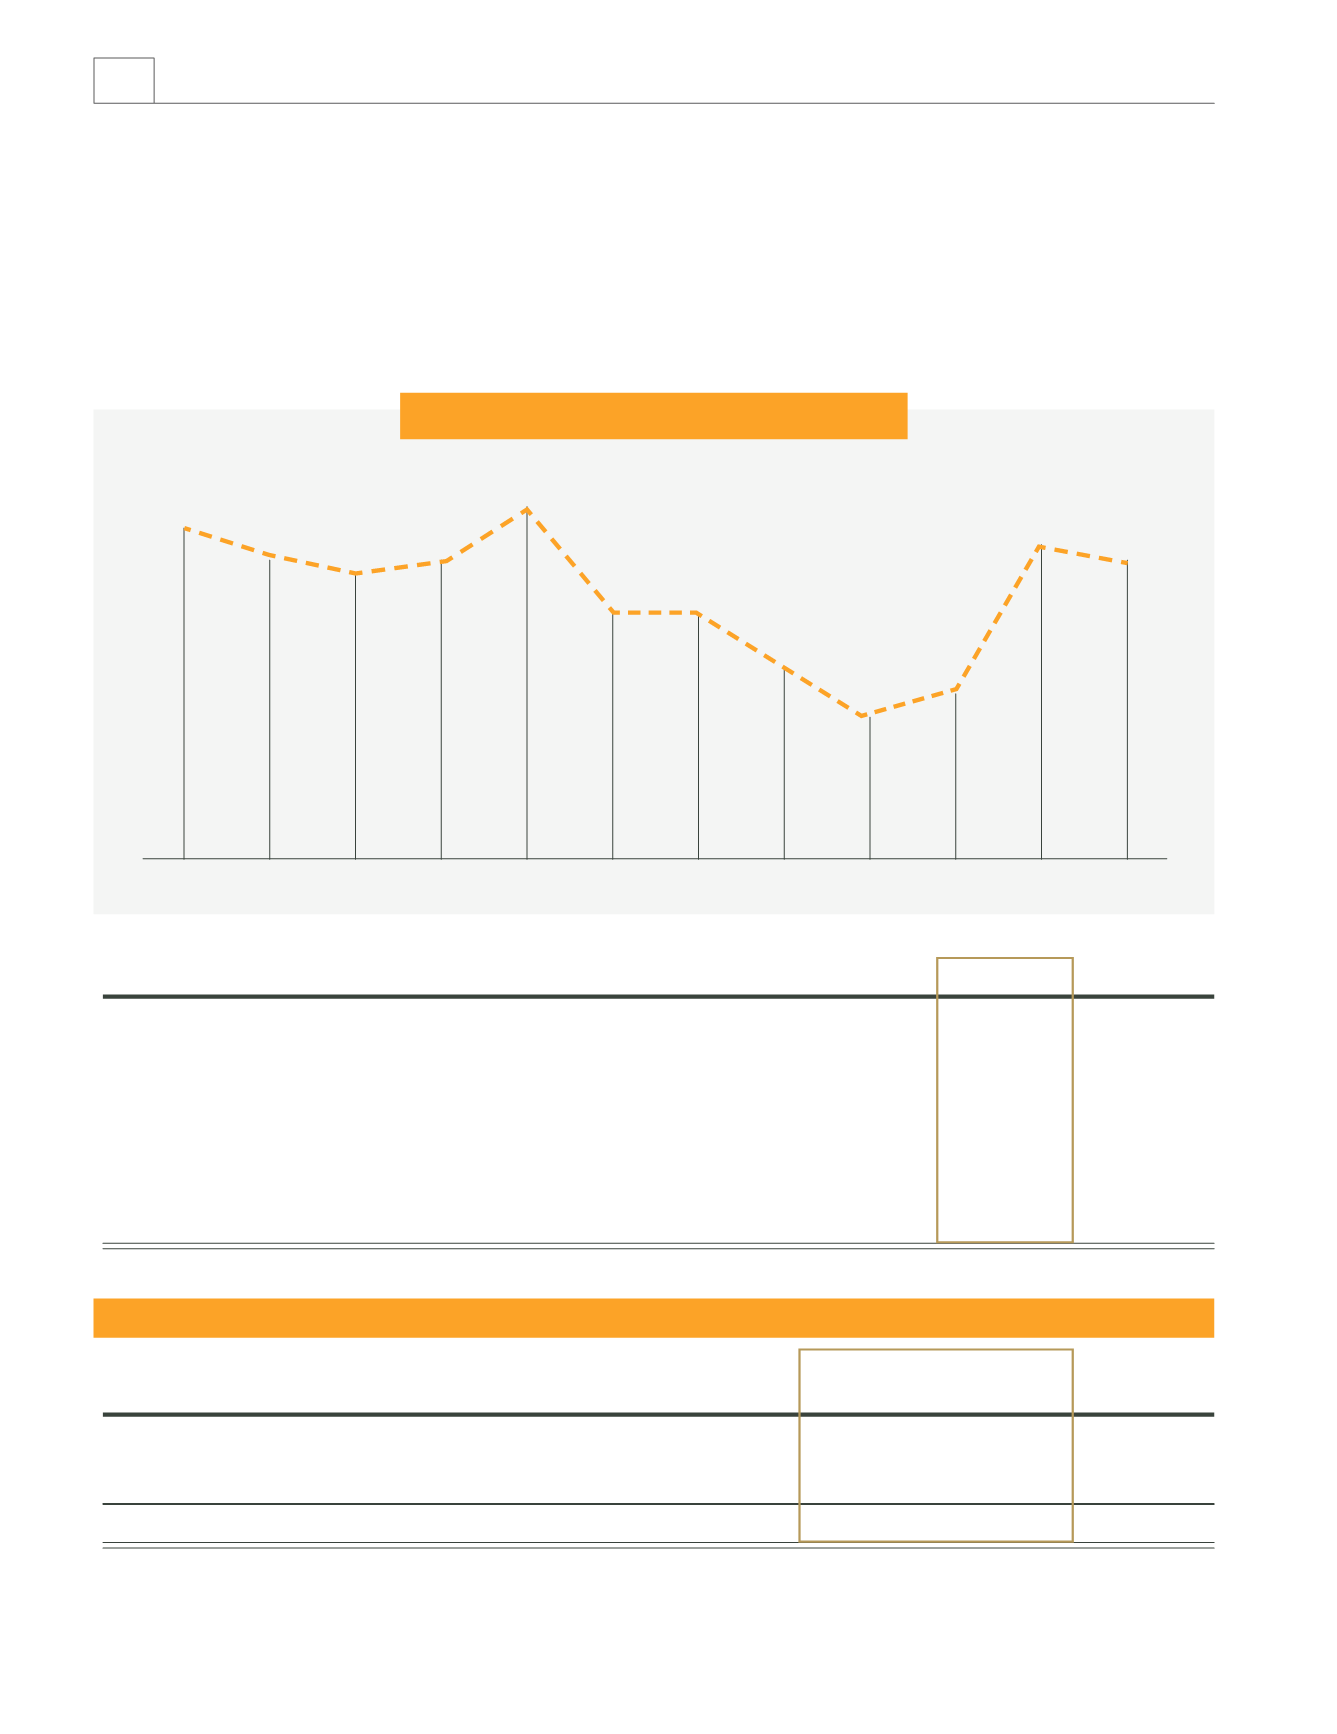
Share Price Performance
One Year Average Monthly Closing Price
Share Price Performance
Apr-16
2.26
May-16
2.23
Jun-16
2.21
Jul-16
2.22
Aug-16
2.28
Sep-16
2.17
Oct-16
2.17
Nov-16
2.11
Dec-16
2.05
Jan-17
2.08
Feb-17
2.24
Mar-17
2.22
2017
2016
Revenue
RM million
372.1
375.2
Earnings before interest and taxation (“EBIT”)
RM million
61.3
77.4
Profit before tax (“PBT”)
RM million
61.3
77.3
Profit after tax (PAT)
RM million
35.0
54.9
Return on average shareholders’ equity (“ROAE”)
%
6.0
9.6
Return on average capital employed (“ROACE”)
%
10.1
13.0
Total returns to shareholders
- dividend (sen per share)
sen
17.5
12.5
Net cash generated from operating activities
RM million
196.3
63.9
SEGMENTAL revenue
2017
2016 Variance
RM’million RM’million
%
Manufacturing
233.3
266.7
(12.5)
Plantation
133.2
102.6
29.8
Property Management
5.6
5.9
(5.1)
Group results
372.1
375.2
(0.8)
MANAGEMENT DISCUSSION AND ANALYSIS