


 15 / 30

Fima CORPORATION Berhad
(197401004110) (21185-P) •
Annual Report 2020
55
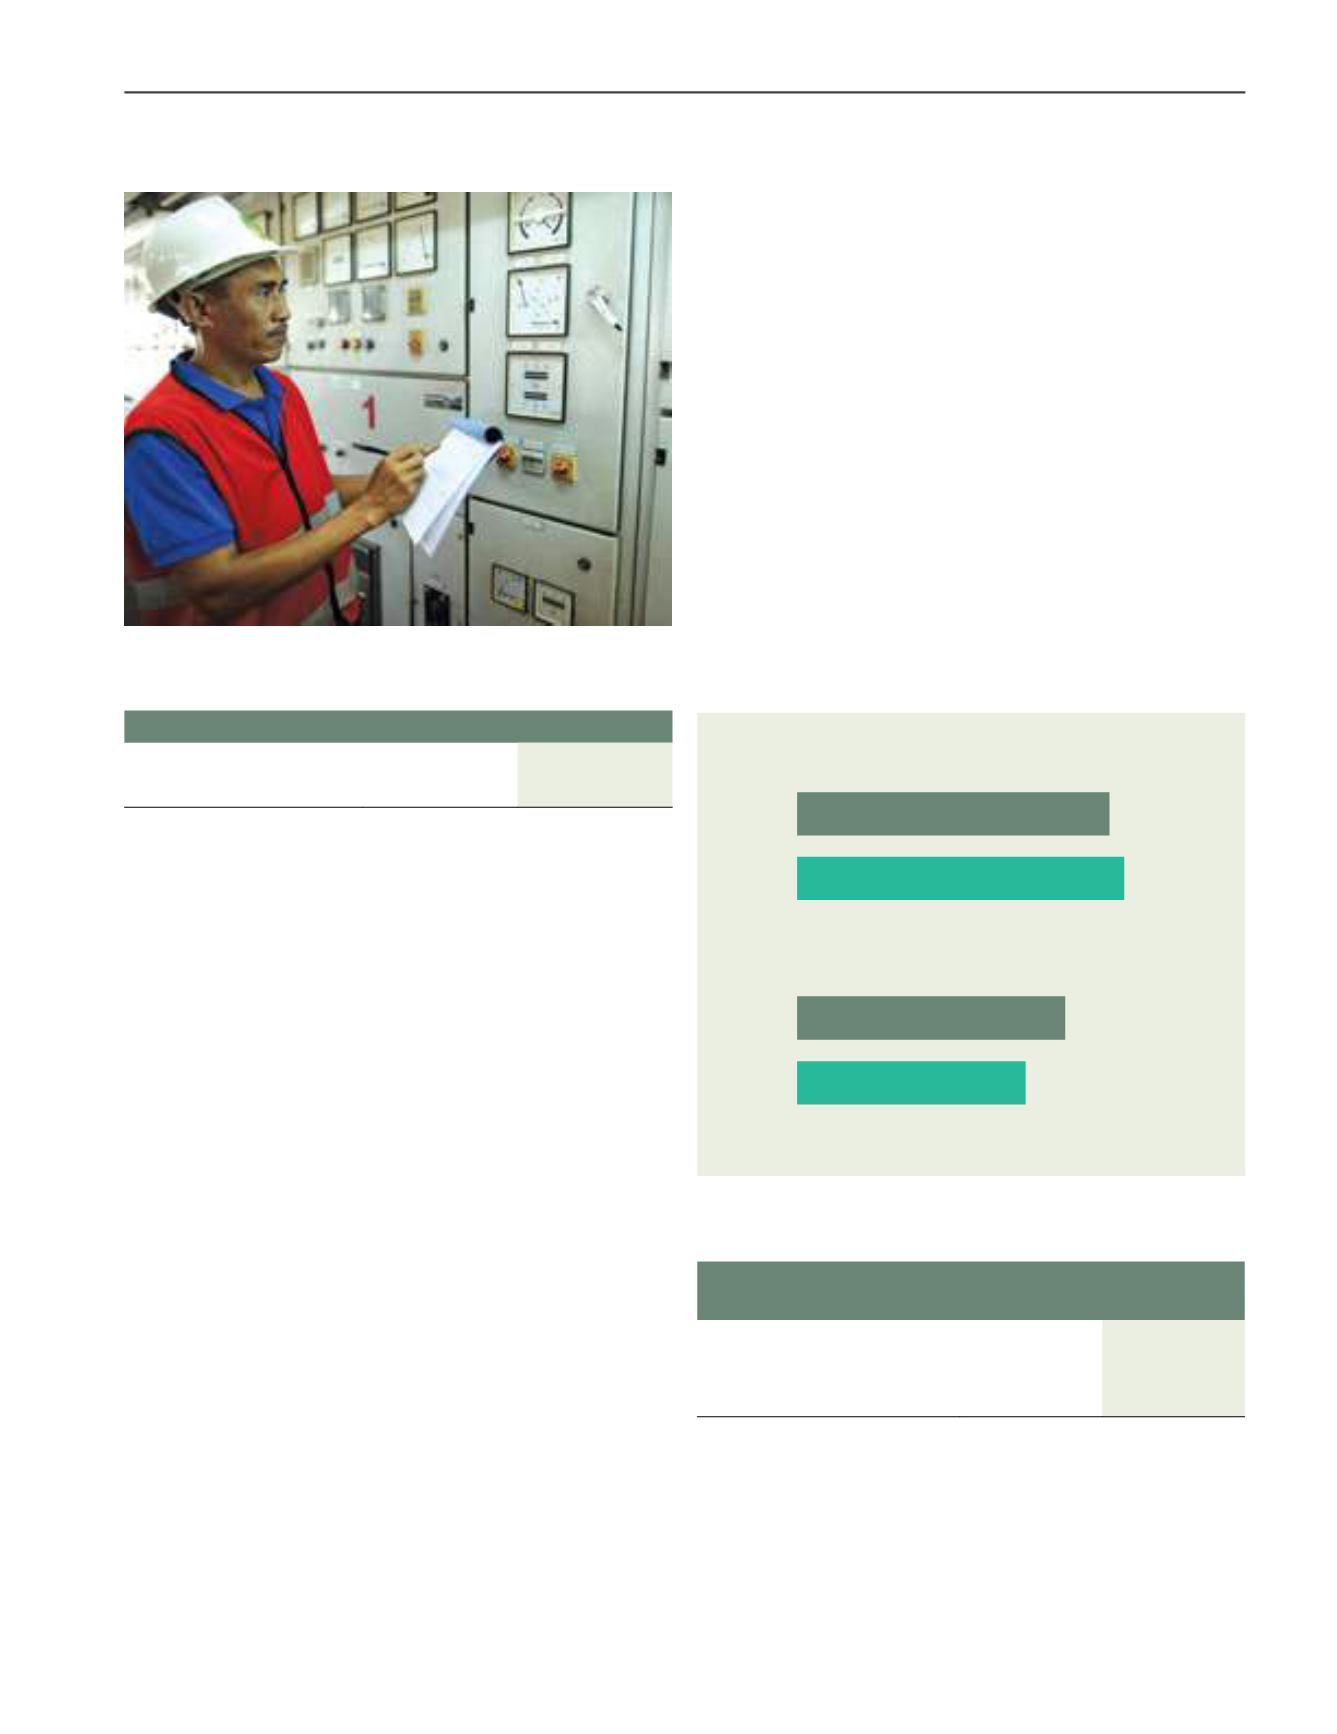
Energy Management
Energy type (GJ)
FYE2019
FYE2020
Renewable
126
581
Non-Renewable
78,720.5
81,983.2
Different businesses have quite different energy use profiles
and scale. For example, our
Plantation Division
is by far the
biggest user of energy in the Group with diesel consumption
topping the list. Recognising that one size does not fit all, the
Group’s Engineering team has been, and continues to identify,
test and refine methods and look for opportunities however
small the scale, to reduce the Group’s energy usage. During the
year, Ladang Cendana had successfully installed solar panels
to generate power supply to their workers quarters and office
complex. To-date, there has been a satisfactory reduction in the
estate’s electricity consumption from the national grid, with an
average 605.23 kWh saved per month, thus reducing the estate’s
average CO
2
e emissions by 0.79 tonnes
1
. This is equivalent to 1,709
kilometre driven by an average passenger car
2
.
Improving our energy efficiency not only reduces the use of
natural resources and emissions of CO₂ and other pollutants but
also potentially lowers costs.
Since 2011, all biomass residue from our palm oil mill in Indonesia
is either converted into fertiliser/compost or clean energy. In
the case of the latter, mesocarp fibre, palm shell and shredded
EFB are utilised as feedstock for the steam boiler and the steam
generated from there will then fuel the steam turbine in the
cogeneration plant. The impact of the utilisation of biomass as
renewable energy has been significant. 86.4% of the electricity
and heat energy generated from the cogeneration plant is used
to power the oil mill’s operations. The excess energy is used to
power worker’s quarters, government facilities, schools and
mosque. In FYE2020, 14,706,530 kWh of electricity was generated
(FYE2019: 6,216,230 kWh).
Emission
We emit GHG both directly and indirectly. Our largest impact
in terms of emissions is direct (scope 1) emissions mainly
from our businesses’ use of petrol, gas and diesel. Our main
source of indirect (scope 2) emissions is electricity used in our
manufacturing and processing operations.
Overall, the Group’s total emission was lower by 0.8% y-o-y. Head
Office showed the most improvements with a 14.8% reduction
y-o-y primarily due to its usage of solar to generate power supply
for the building.
Total Group CO
2
eq - Scope 2
FYE2019
2,865*
FYE2020
2,632
Total Group CO
2
eq - Scope 1
FYE2019
16,570*
FYE2020
16,648
Head Office
Our greenhouse gas
emissions
FYE 2019
FYE 2020
Scope 1 – Direct emission
0 tCO
2
eq*
0 tCO
2
eq
Scope 2 – Indirect emission
1,022 tCO
2
eq*
871 tCO
2
eq
Total emissions
1,022 tCO
2
eq*
871 tCO
2
eq
*Figures for FYE2019 has been restated
Our Head Office’s direct emissions remain at zero this year. The
shift to solar power has also lessened the impact of our Head
Office’s indirect (scope 2) emissions.
*Figures for FYE2019 has been restated
Source:
1. Based on emission factor from Malaysia Green Technology Corporation
2. US EPA calculator
sustainability : environment