


 16 / 30

Fima CORPORATION Berhad
(197401004110) (21185-P) •
Annual Report 2020
56
Manufacturing
Our greenhouse gas
emissions
FYE 2019
FYE 2020
Scope 1 – Direct emission
20 tCO
2
eq*
16 tCO
2
eq
Scope 2 – Indirect emission
1,816 tCO
2
eq*
1,734 tCO
2
eq
Total emissions
1,836 tCO
2
eq*
1,750 tCO
2
eq
*Figures for FYE2019 has been restated
Manufacturing Division
’s petrol and diesel consumption in
FYE2020 was lower as a result of lower production compared to
the previous year which in turn reduced its scope 1 emissions.
Similarly, electricity consumption had also reduced as a result of
effective promotion of sustainable practices such as switching
off light sockets and electronic devices at times when not in use
thereby resulting in lower indirect (scope 2) emissions of 4.5%.
Plantation
Our greenhouse gas
emissions
FYE 2019
FYE 2020
Scope 1 – Direct emission
16,550 tCO
2
eq* 16,632 tCO
2
eq
Scope 2 – Indirect emission
27 tCO
2
eq*
27 tCO
2
eq
Total emissions
16,577 tCO
2
eq*
16,659 tCO
2
eq
*Figures for FYE2019 has been restated
Figures in FYE2020 indicates that the
Plantation Division
total
emissions has increased by 0.5% last year due to higher fertilizer
applications. However, methane emissions were 7.7% lower than
last year.
Note: Scope 1 – CO
2
emissions through a diesel engine, transportation, chemical or
physical operation
Scope 2 – Purchase of electricity from TNB
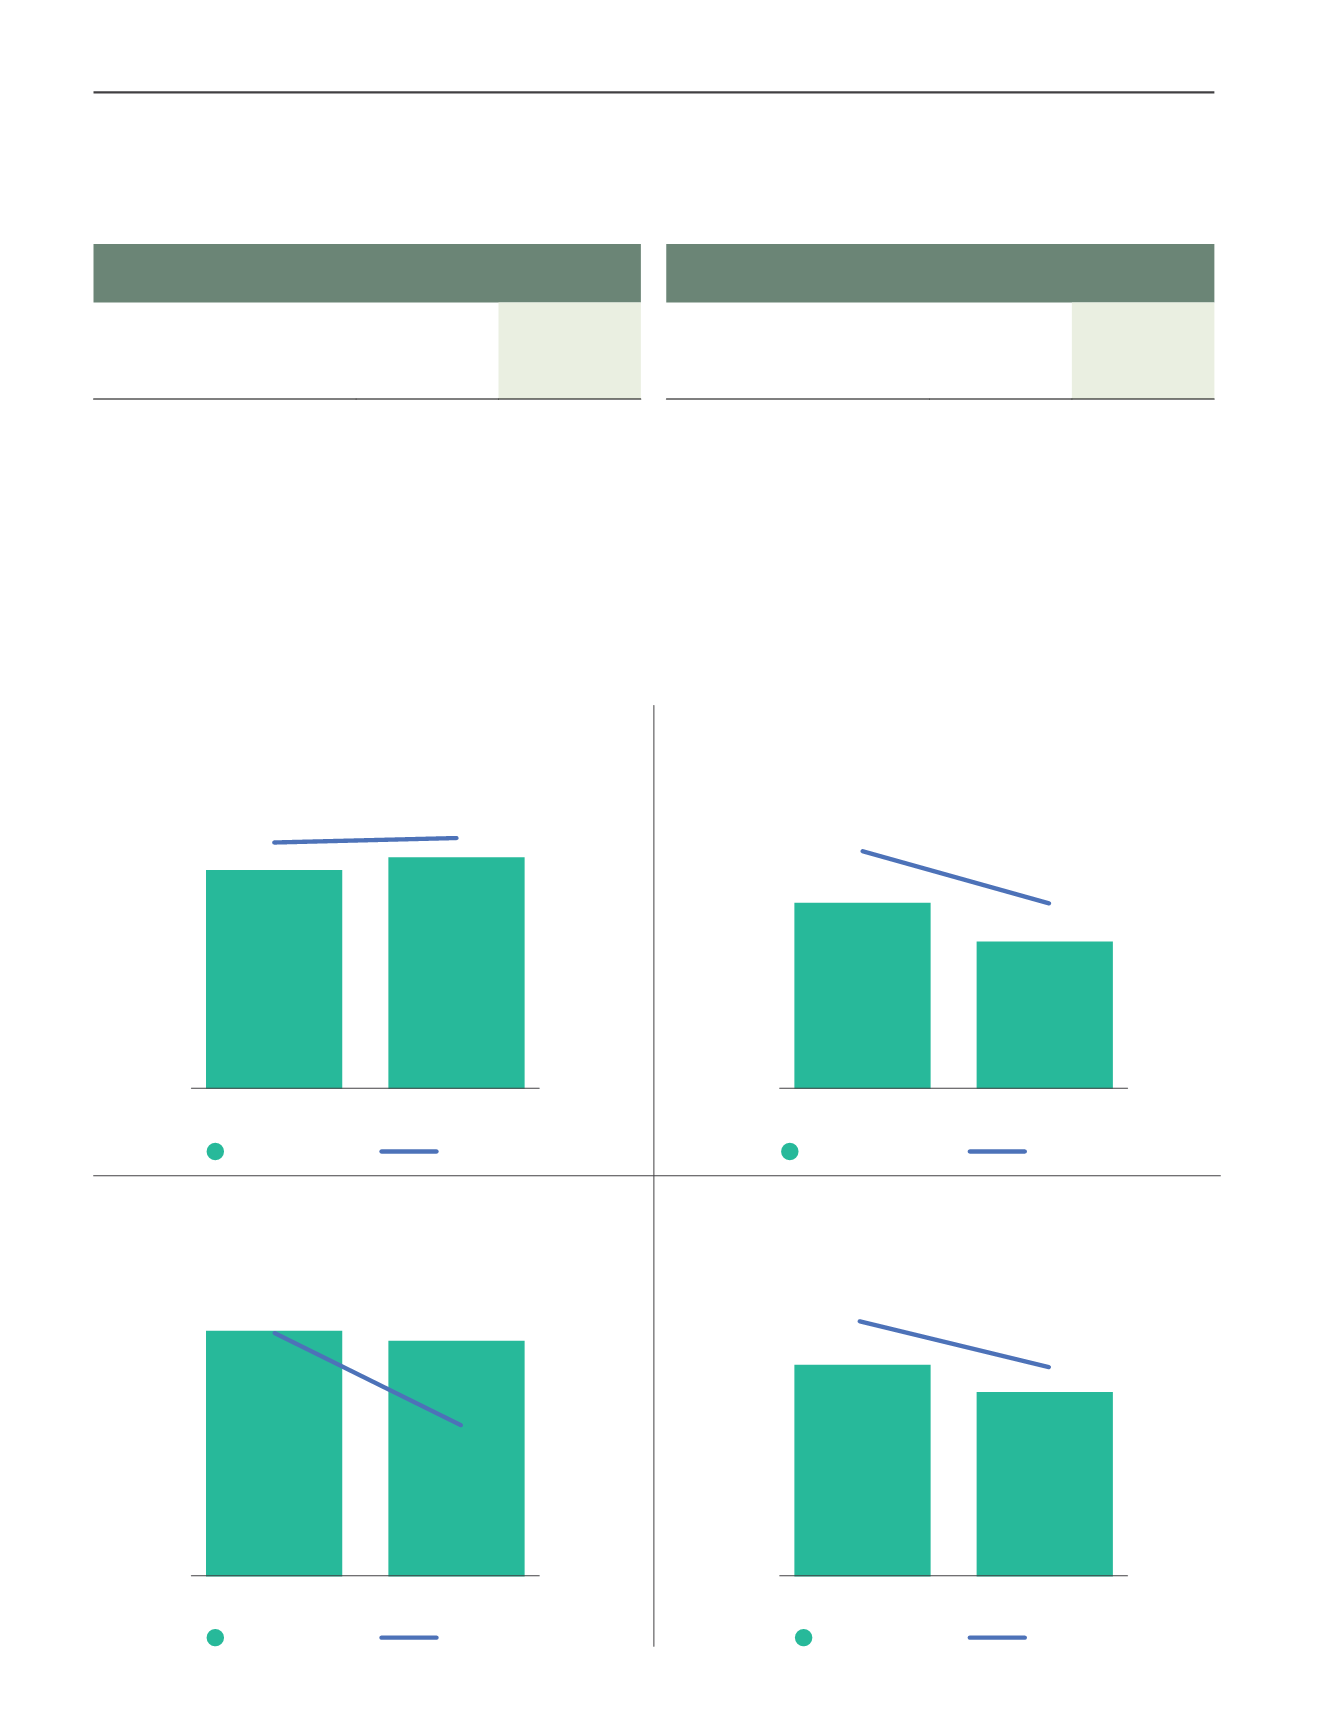
Group’s Intensity
Plantation-
Transport & Equipment Intensity
Diesel Consumption per Ton FFB Production
1,682,020
1,589,871
8.69
8.72
2,000,000
1,500,000
1,000,000
500,000
0
10.00
8.00
6.00
4.00
2.00
0.00
FYE2019
FYE2020
Diesel (L)
Intensity
Manufacturing-
Electricity Intensity
Electricity Consumption per Operation Hours
2,599,790
2,722,682
811.77
545.54
3,000,000
2,500,000
2,000,000
1,500,000
1,000,000
500,000
0
1000
800
600
400
200
0
FYE2019
FYE2020
kWh
Intensity
Plantation-
Water Intensity
Water Consumption per Ton FFB Processed
295,530
384,230
2.14
1.60
500,000
400,000
300,000
200,000
100,000
0
2.5
2
1.5
1
0.5
0
FYE2019
FYE2020
Water (m
3
)
Intensity
Head Office-
Electricity Intensity
Electricity Consumption per sqft area
1,305,149
1,532,704
12.22
10.41
1,800,000
1,600,000
1,400,000
1,200,000
1,000,000
800,000
600,000
400,000
200,000
0
14
12
10
8
6
4
2
0
FYE2019
FYE2020
kWh
Intensity
sustainability : environment